Detecting Goroutine Leaks Like Memory Leaks? goroutineleak Helps Us Pinpoint Goroutine Leaks Faster
Introduction
In Go development, goroutine leaks are a common but subtle problem: when a goroutine is blocked on some synchronization primitive (such as a channel or mutex), and that primitive becomes permanently unreachable, the goroutine is effectively “leaked.”
Each leaked goroutine occupies at least 2 KB of stack memory. Over time this can cause:
- Steadily increasing memory usage
- More pressure on the scheduler
- Eventually, OOM crashes or noticeable service performance degradation
Previously, developers typically relied on manual code review or third-party tools (such as goleak) to detect goroutine leaks—both low in efficiency and easy to miss issues. But Go’s experimental feature goroutineleak changes that.
It integrates goroutine leak detection directly into the garbage collector (GC), so we can locate leaking goroutines via pprof, almost as easily as we detect memory leaks.
How GC Detects Goroutine Leaks
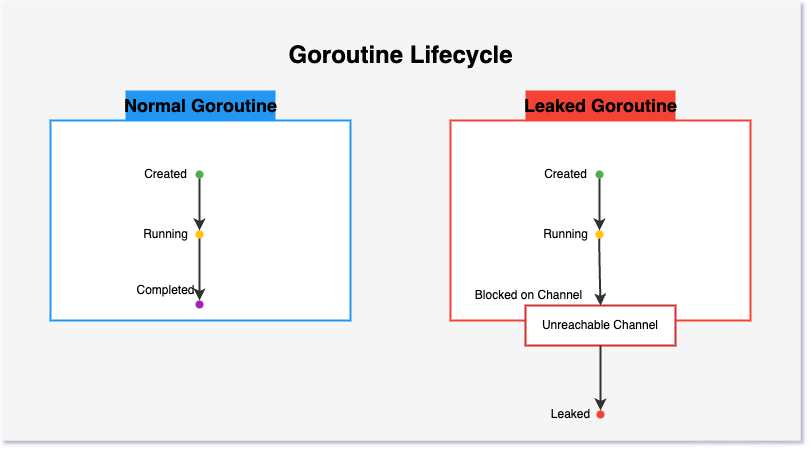
1) Lifecycle Characteristics of Leaked Goroutines
A normal goroutine goes through a complete lifecycle: create → run → exit.
A leaked goroutine, on the other hand, gets stuck in a blocked state, and the synchronization primitive it’s blocked on has been deemed unreachable by GC.
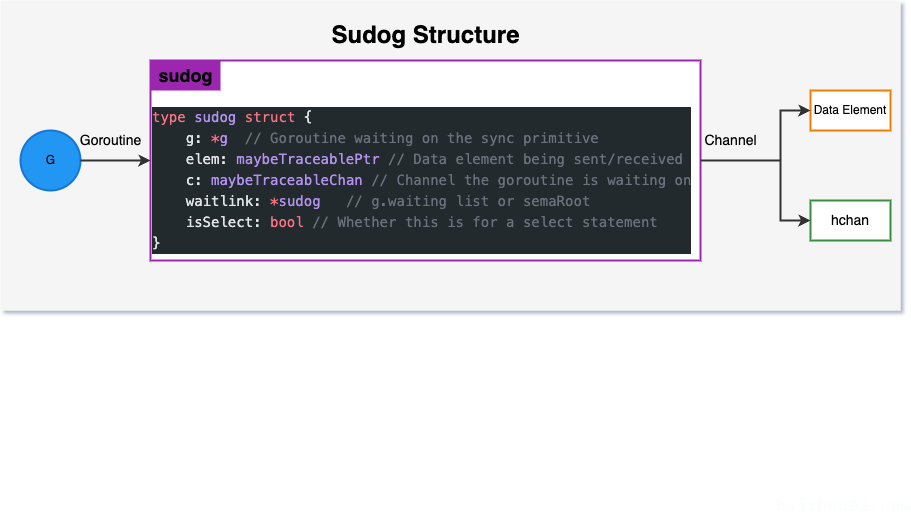
2) sudog: The Bridge between Goroutines and Synchronization Primitives
The Go runtime tracks goroutines blocked on synchronization primitives via the sudog struct. Each sudog contains:
- A pointer to the blocked goroutine
- A pointer to the synchronization primitive (channel, mutex, etc.)
- Linked-list information for the wait queue
3) GC-based Leak Detection Workflow
goroutineleak extends the GC to perform leak detection. The core workflow looks like this:
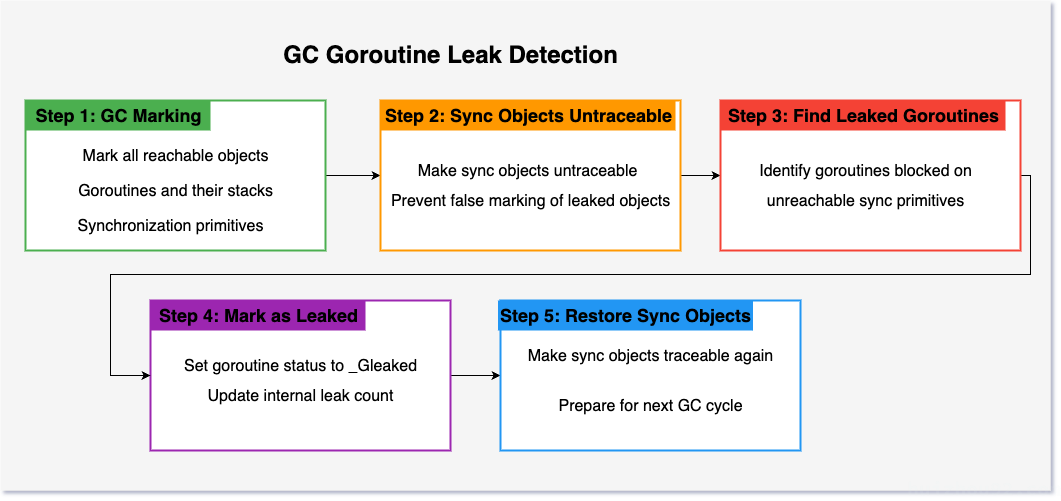
Key technical points:
- Special GC cycle: a GC cycle is triggered with additional leak detection logic
- Unreachability check: identify all goroutines blocked on unreachable synchronization primitives
- State marking: mark leaked goroutines with the
_Gleakedstate - Result exposure: expose results via the
/debug/pprof/goroutineleakendpoint inpprof
3. Usage: As Simple as pprof
1) Environment Setup: Install gotip
Since goroutineleak is currently under development and not available in a stable Go release, we can try it out in advance using gotip:
|
|
2) Running a Leak Detection Demo
Let’s write a small demo that intentionally creates a goroutine leak:
|
|
Then run:
|
|
3) Using pprof to Locate Leaks
In another terminal, run:
|
|
4) Analyzing pprof Results
|
|
Pretty convenient, right?
4. What This Means for Developers
1) A Unified Debugging Experience
Developers can reuse the pprof tooling they already know to detect goroutine leaks—no need to learn new tools or modify application code.
2) Higher Debugging Efficiency
- Automatically pinpoint the exact code location of leaks
- No need to manually track each goroutine’s lifecycle
- Combine with stack traces to quickly understand the root cause
3) From “reactive firefighting” to “proactive prevention”
- Integrate into CI/CD during development
- Periodically check in production to catch issues early
- Reduce performance degradation and outages caused by leaks
4) Deeper Understanding of the Go Runtime
By using goroutineleak, developers can better understand:
- How the Go runtime manages goroutines
- How synchronization primitives interact with goroutines
- The role of GC in resource management
Conclusion
The experimental goroutineleak feature gives Go developers an efficient, built-in way to detect goroutine leaks, turning a previously hidden problem into something as straightforward to inspect as memory leaks. Although it’s still experimental, it showcases the Go team’s ongoing effort to improve developer experience and service reliability.
For high-performance, highly reliable Go applications, goroutineleak is well worth trying—it helps you find problems faster and write more robust code.
Note: Right now,
goroutineleakcan only detect leaked goroutines; it cannot automatically free them. You still need to fix the underlying issues in your code (e.g., closing channels, ensuring synchronization primitives remain reachable, etc.) based on the detection results.