像检测内存泄露一样检测goroutine泄露? Goroutineleak 帮助我们更快的定位goroutine Leak
一、介绍
在Go语言开发中,goroutine泄露是一种常见但隐蔽的问题:当一个goroutine被阻塞在某个同步原语(如channel、mutex)上,且该同步原语永远不可达时,这个goroutine就会被"泄露"。
每个泄露的goroutine会占用至少2KB的栈内存,随着时间积累,会导致:
- 内存占用持续增长
- 调度器负担加重
- 最终可能引发OOM或服务性能下降
此前,开发者通常需要通过手动代码审查或第三方工具(如goleak)来检测goroutine泄露,效率较低且容易遗漏。但Go语言的实验性特性goroutineleak改变了这一现状——它将goroutine泄露检测集成到了垃圾收集器(GC)中,让我们可以像检测内存泄露一样,通过pprof轻松定位泄露的goroutine。
二、原理:GC如何识别goroutine泄露
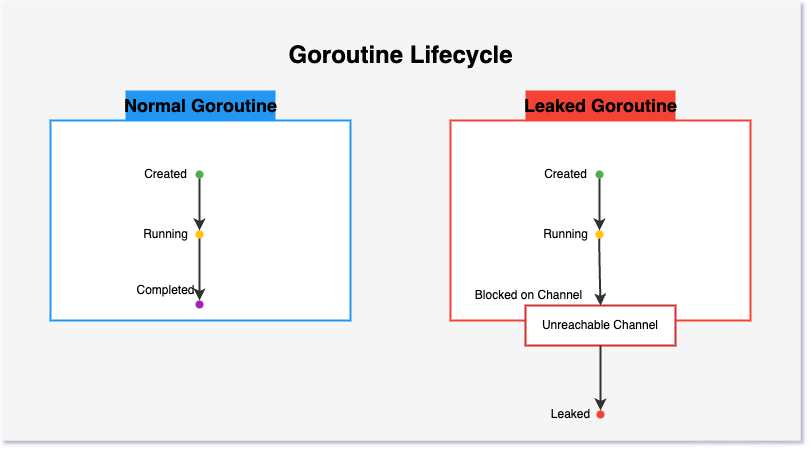
1. 泄露goroutine的生命周期特征
正常goroutine会经历「创建→运行→结束」的完整生命周期;而泄露的goroutine会卡在「阻塞」状态,且阻塞它的同步原语已经被GC判定为不可达。
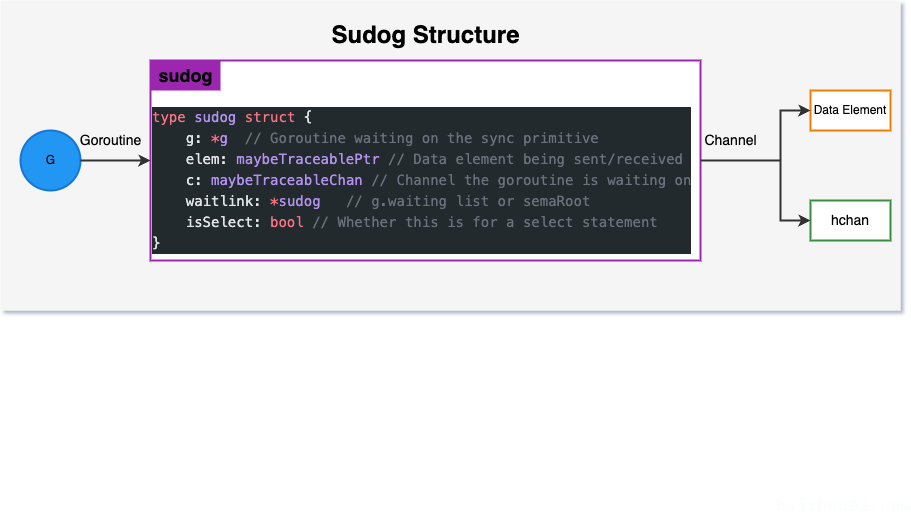
2. Sudog:连接goroutine与同步原语的桥梁
Go运行时通过sudog结构体跟踪阻塞在同步原语上的goroutine。每个sudog包含:
3. GC-based 泄露检测流程
goroutineleak通过扩展GC的功能实现泄露检测,核心流程如下:
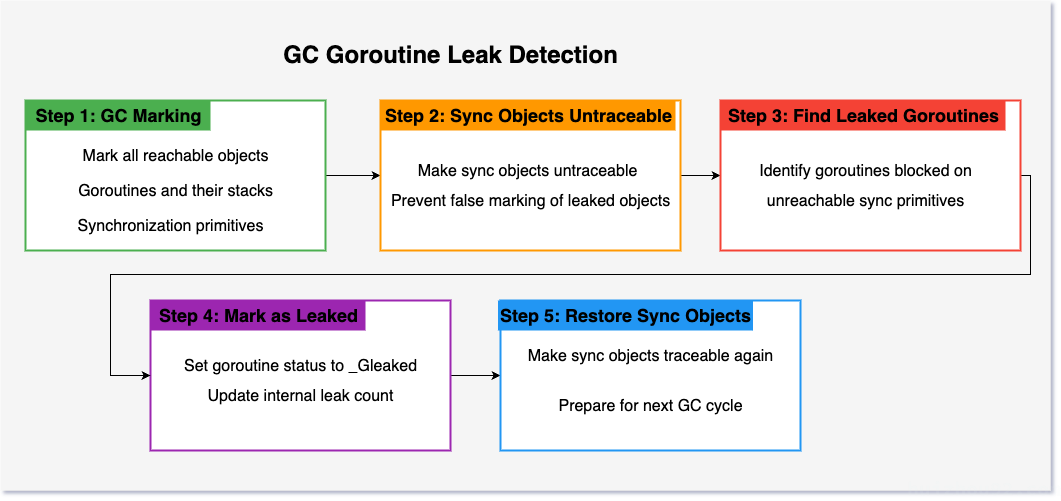
关键技术点:
- 特殊GC循环:触发带有泄露检测逻辑的GC周期
- 不可达性检查:识别所有阻塞在不可达同步原语上的goroutine
- 状态标记:将泄露的goroutine标记为
_Gleaked状态
- 结果暴露:通过pprof的
/debug/pprof/goroutineleak端点提供检测结果
三、使用:像pprof一样简单
1. 环境准备:安装gotip
由于goroutineleak目前还属于开发节点,不能在正式版本体验它,但是我们可以通过 gotip 提前体验这个功能:
1
2
|
go install golang.org/dl/gotip@latest
gotip download
|
2. 运行泄露检测Demo
我们写一个 内存泄露的 demo。
 1
 2
 3
 4
 5
 6
 7
 8
 9
10
11
12
13
14
15
16
17
18
19
20
21
22
23
24
25
26
27
28
29
30
31
32
33
34
35
36
37
38
39
40
41
42
|
func main() {
	// Start pprof server to expose goroutineleak profile
	go func() {
		log.Printf("pprof server started at http://localhost:6060")
		if err := http.ListenAndServe(":6060", nil); err != nil {
			log.Fatalf("failed to start pprof server: %v", err)
		}
	}()

	// Create a goroutine leak
	createLeakedGoroutine()

	// Keep the program running to allow pprof inspection
	fmt.Println("Demo program running...")
	fmt.Println("Use this command to check for leaks:")
	fmt.Println("   GOEXPERIMENT=goroutineleakprofile gotip tool pprof http://localhost:6060/debug/pprof/goroutineleak")
	fmt.Println("Press Ctrl+C to exit")

	// Wait for interrupt signal to gracefully exit
	sigCh := make(chan os.Signal, 1)
	signal.Notify(sigCh, syscall.SIGINT, syscall.SIGTERM)
	<-sigCh

	log.Println("Shutting down demo program...")
}

// createLeakedGoroutine intentionally creates a leaked goroutine
func createLeakedGoroutine() {
	// Create a channel but never write to it or close it
	ch := make(chan int)

	// Start a goroutine that blocks forever on channel receive
	go func() {
		fmt.Println("Leaked goroutine started - waiting for channel data")
		<-ch // This goroutine will never return
		fmt.Println("Leaked goroutine should never reach this line")
	}()

	// The channel 'ch' is not accessible after this function returns,
	// so both the channel and the goroutine are leaked
	fmt.Println("Created a leaked goroutine - channel is now unreachable")
}
|
然后
1
2
|
# 启动带有泄露检测的程序
GOEXPERIMENT=goroutineleakprofile gotip run main.go
|
3. 使用pprof定位泄露
在另一个终端执行:
1
2
|
# 使用专门的泄露检测profile
GOEXPERIMENT=goroutineleakprofile gotip tool pprof http://localhost:6060/debug/pprof/goroutineleak
|
4. 分析pprof结果
 1
 2
 3
 4
 5
 6
 7
 8
 9
10
11
12
13
14
15
16
17
18
19
20
21
22
23
24
25
26
27
28
29
|
# 查看泄露的goroutine
(pprof) top
Showing nodes accounting for 1, 100% of 1 total
      flat  flat%   sum%        cum   cum%
         1   100%   100%          1   100%  runtime.gopark
         0     0%   100%          1   100%  main.createLeakedGoroutine.func1
         0     0%   100%          1   100%  runtime.chanrecv
         0     0%   100%          1   100%  runtime.chanrecv1

# 查看泄露点的具体代码
(pprof) list main.createLeakedGoroutine.func1
Total: 1
ROUTINE ======================== main.createLeakedGoroutine.func1 in /path/to/goroutineleak_example/main.go
         1          1 (flat, cum)   100% of Total
            .          .     27:func createLeakedGoroutine() {
            .          .     28:	// Create a channel but never write to it or close it
            .          .     29:	ch := make(chan int)
            .          .     30:
            .          .     31:	// Start a goroutine that blocks forever on channel receive
            .          .     32:	go func() {
            .          .     33:		fmt.Println("Leaked goroutine started - waiting for channel data")
         1          1     34:		<-ch // This goroutine will never return
            .          .     35:		fmt.Println("Leaked goroutine should never reach this line")
            .          .     36:	}()
            .          .     37:
            .          .     38:	// The channel 'ch' is not accessible after this function returns,
            .          .     39:	// so both the channel and the goroutine are leaked
            .          .     40:	fmt.Println("Created a leaked goroutine - channel is now unreachable")
            .          .     41:}
|
是不是很方便?
四、对开发者的意义
1. 统一的调试体验
开发者可以使用已经熟悉的pprof工具链来检测goroutine泄露,无需学习新工具或修改代码。
2. 提高调试效率
- 自动定位泄露的具体代码位置
- 无需手动跟踪每个goroutine的生命周期
- 结合stack trace快速理解泄露原因
3. 从"被动救火"到"主动预防"
- 可以在开发阶段集成到CI/CD流程中
- 在生产环境中定期检测,提前发现隐患
- 减少因泄露导致的性能问题和服务中断
4. 加深对Go运行时的理解
通过使用goroutineleak,开发者可以更好地理解:
- Go运行时如何管理goroutine
- 同步原语与goroutine的关系
- GC在资源管理中的作用
总结
goroutineleak实验特性为Go开发者提供了一种高效、原生的goroutine泄露检测方案,将原本隐蔽的问题变得像检测内存泄露一样直观。虽然目前仍是实验性特性,但它展示了Go团队在提升开发体验和服务可靠性方面的持续努力。
对于追求高性能、高可靠性的Go应用来说,goroutineleak是一个值得尝试的工具——它能帮助我们更快地定位问题,从而写出更健壮的代码。
注意:goroutineleak目前仅能检测泄露的goroutine,无法自动释放它们。开发者需要根据检测结果手动修复代码中的根本原因(如关闭channel、确保同步原语可达性等)。