Featured image of post Go 高性能编程 EP8: 如何通过优化GC来提高Golang代码的性能

Go 高性能编程 EP8: 如何通过优化GC来提高Golang代码的性能


我们在用golang 写程序的时候,一般不会去过分关注内存,因为golang 运行时能够很好的帮我们完成GC 工作,但是如果遇到了需要性能优化的场景,我们能够了解一些GC 的知识,以及如何优化GC,会有很大的收益。 这篇文章,我们通过一个解析XML文件的服务来学习一下。如何通过go trace 来优化GC,提高代码的性能。
感谢 Arden Lions 优秀的演讲Evaluating Performance In Go。这篇文章可以理解成演讲的 blog 版本。

如果您对 go trace 不太熟悉,可以先看一下@Vincent的文章Go: Discovery of the Trace Package

所有的例子都在我的MacBook Pro M1 上运行,它有十个核心。

我们的目标是实现一个从多个RSS XML文件处理程序,从title寻找包含go关键字的的item,这里,我使用我的博客的RSS XML文件作为示例,解析这个文件100次,模拟压力。
完整的代码:https://github.com/hxzhouh/blog-example/tree/main/go/go_trace%20

single

list1: 使用单协程统计key

 1
 2
 3
 4
 5
 6
 7
 8
 9
10
11
12
13
14
15
16
17
18
19
20
21
22
23
24
25
26
27
28
29
30
31
32
33
34
35
func freq(docs []string) int {  
    var count int  
    for _, doc := range docs {  
       f, err := os.OpenFile(doc, os.O_RDONLY, 0)  
       if err != nil {  
          return 0  
       }  
       data, err := io.ReadAll(f)  
       if err != nil {  
          return 0  
       }  
       var d document  
       if err := xml.Unmarshal(data, &d); err != nil {  
          log.Printf("Decoding Document [Ns] : ERROR :%+v", err)  
          return 0  
       }  
       for _, item := range d.Channel.Items {  
          if strings.Contains(strings.ToLower(item.Title), "go") {  
             count++  
          }  
       }  
    }  
    return count  
}

func main() {  
    trace.Start(os.Stdout)  
    defer trace.Stop()  
    files := make([]string, 0)  
    for i := 0; i < 100; i++ {  
       files = append(files, "index.xml")  
    }  
    count := freq(files)  
    log.Println(fmt.Sprintf("find key word go %d count", count))  
}

代码很简单,我们使用一个for循环就完成任务了。然后运行

1
2
3
4
5
6
➜  go_trace git:(main) ✗ go build                      
➜  go_trace git:(main)time ./go_trace 2 > trace_single.out

-- result --
2024/08/02 16:17:06 find key word go 2400 count
./go_trace 2 > trace_single.out  1.99s user 0.05s system 102% cpu 1.996 total

然后我们使用 go trace 查看 trace_single.out
RunTime :2031ms, STW: 57ms, GC Occurrences :252ms ,GC STW AVE: 0.227ms
GC 时间 占用总运行时间为: 57 / 2031 ≈ 0.02
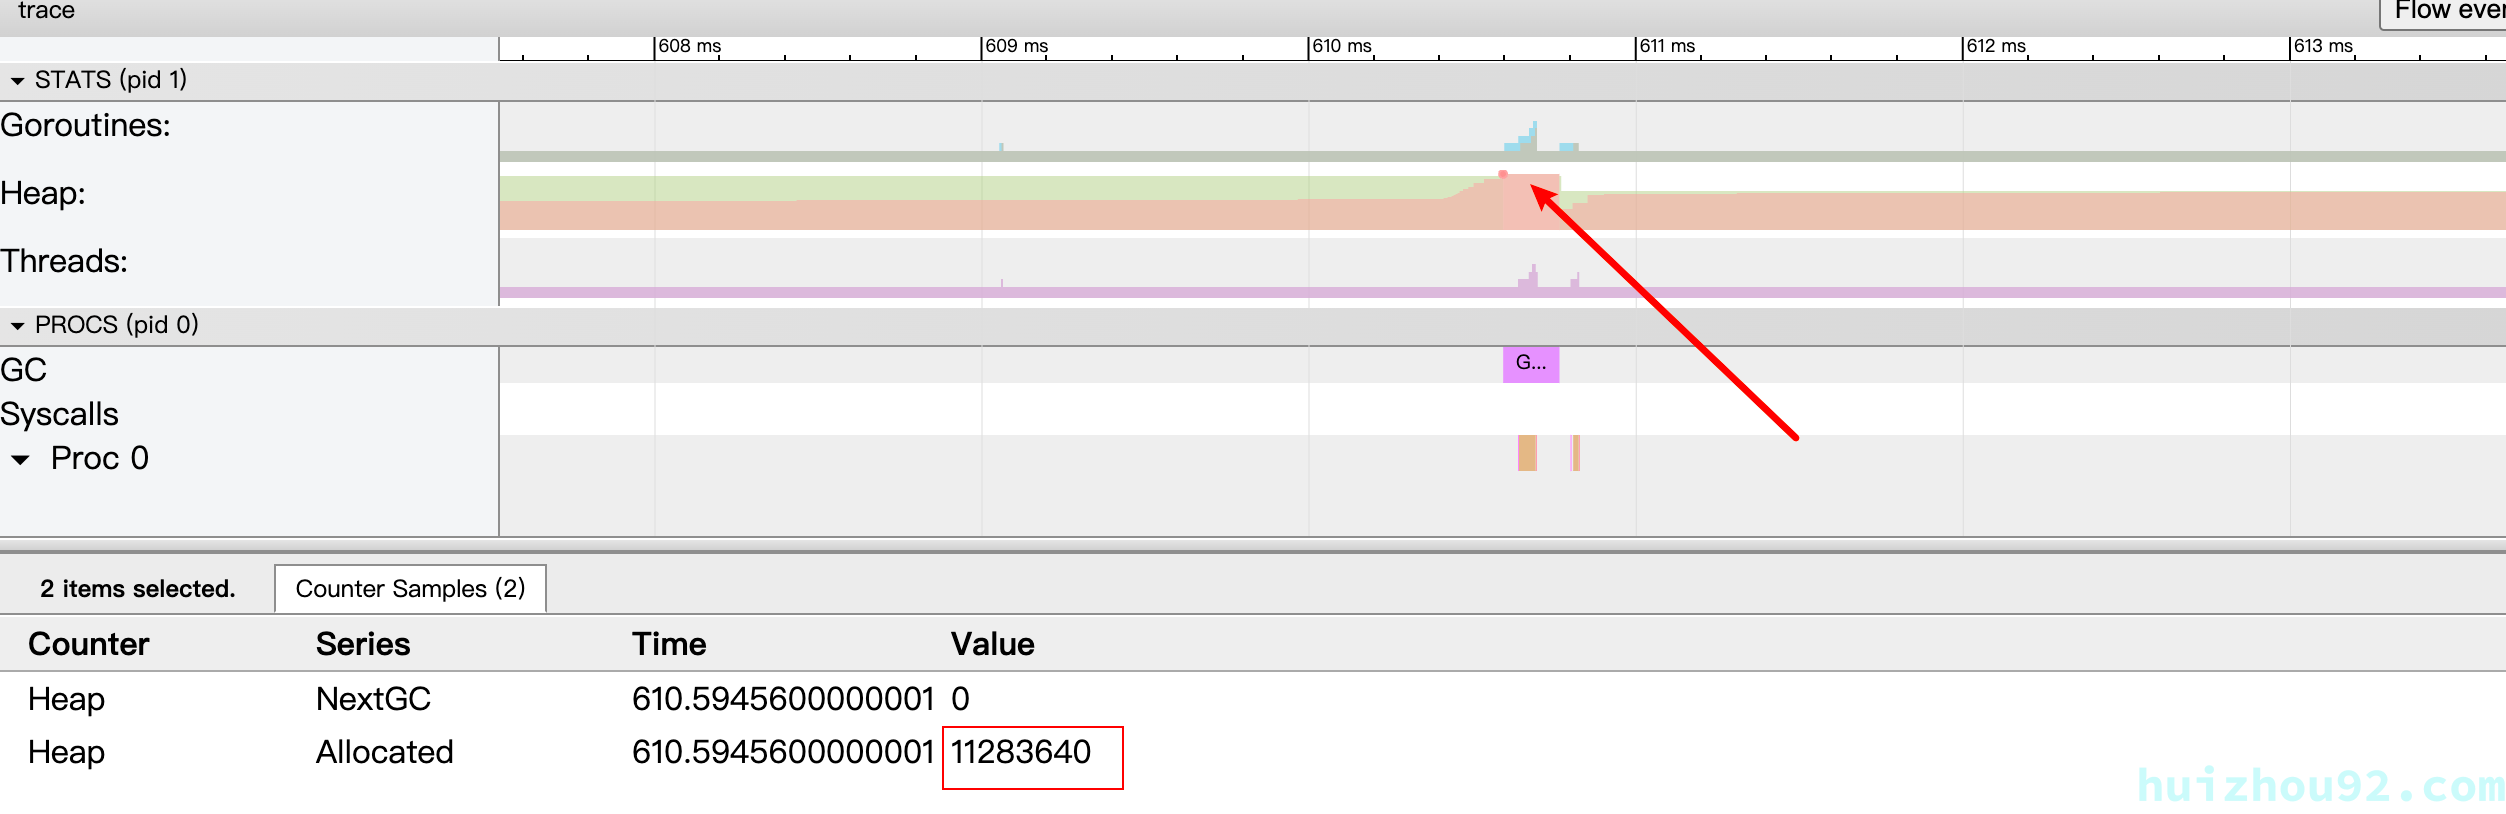
使用最大的内存为11.28M左右
Figure 1: single: run time
Pasted image 20240802163816
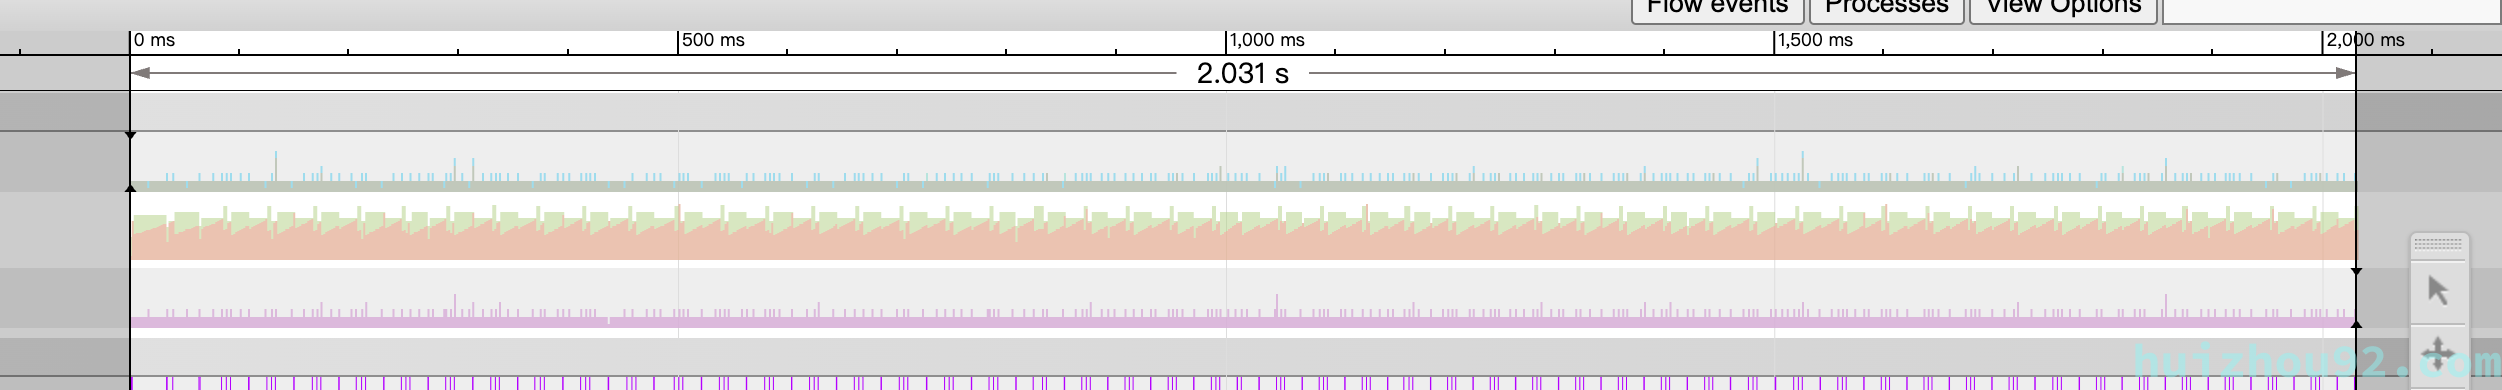
Figure 2: single: GC
Pasted image 20240802164009
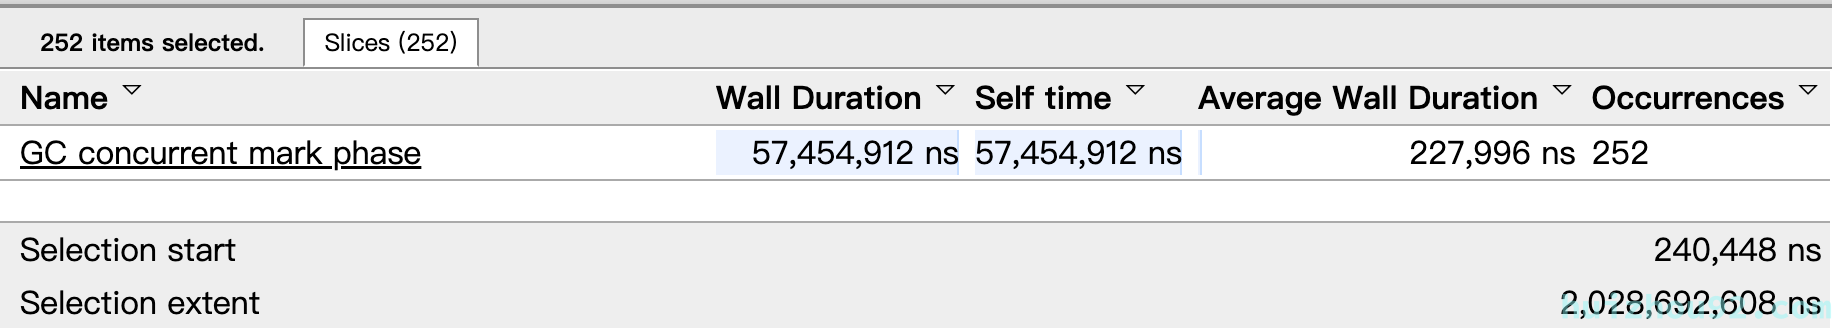
Figure 3: single: max heap
Pasted image 20240802190155
我们现在只使用了一个核心,资源利用率太低,如果我们想加速这个程序,最好是使用并发,这也是go最擅长的部分。

concurrent

List 2: 使用 FinOut 方式统计 key。

 1
 2
 3
 4
 5
 6
 7
 8
 9
10
11
12
13
14
15
16
17
18
19
20
21
22
23
24
25
26
27
28
29
30
31
32
33
34
35
36
37
38
39
40
41
42
43
44
45
46
func concurrent(docs []string) int {  
    var count int32  
    g := runtime.GOMAXPROCS(0)  
    wg := sync.WaitGroup{}  
    wg.Add(g)  
    ch := make(chan string, 100)  
    go func() {  
       for _, v := range docs {  
          ch <- v  
       }  
       close(ch)  
    }()  
  
    for i := 0; i < g; i++ {  
       go func() {  
          var iFound int32  
          defer func() {  
             atomic.AddInt32(&count, iFound)  
             wg.Done()  
          }()  
          for doc := range ch {  
             f, err := os.OpenFile(doc, os.O_RDONLY, 0)  
             if err != nil {  
                return  
             }  
             data, err := io.ReadAll(f)  
             if err != nil {  
                return  
             }  
             var d document  
             if err = xml.Unmarshal(data, &d); err != nil {  
                log.Printf("Decoding Document [Ns] : ERROR :%+v", err)  
                return  
             }  
             for _, item := range d.Channel.Items {  
                if strings.Contains(strings.ToLower(item.Title), "go") {  
                   iFound++  
                }  
             }  
          }  
       }()  
    }  
  
    wg.Wait()  
    return int(count)  
}

使用同样的方式运行

1
2
3
4
5
go build
time ./go_trace 2 > trace_pool.out
--- 
2024/08/02 19:27:13 find key word go 2400 count
./go_trace 2 > trace_pool.out  2.83s user 0.13s system 673% cpu 0.439 total

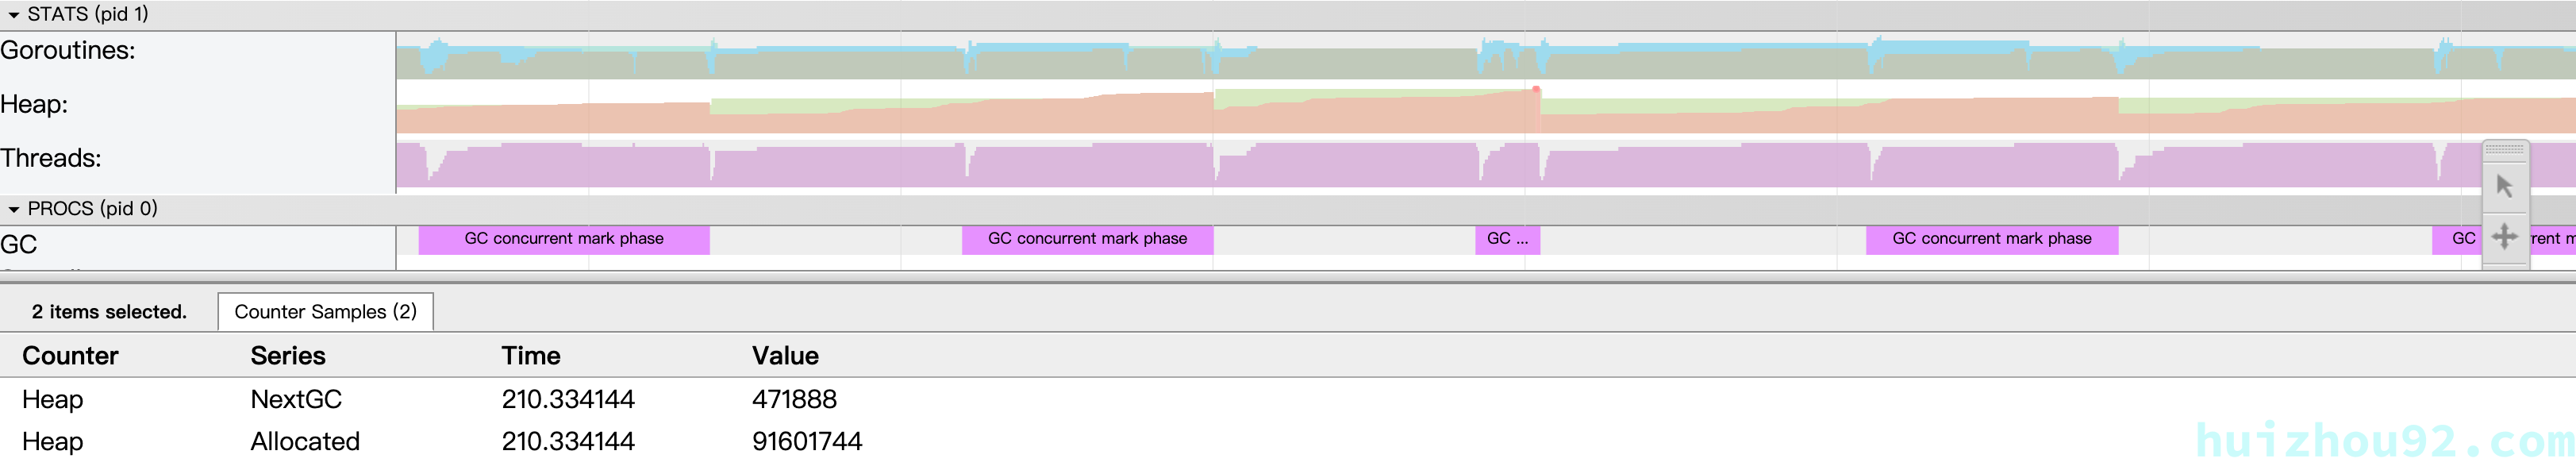
RunTime :425ms, STW: 154ms, GC Occurrences :39 ,GC STW AVE: 3.9ms
GC 时间 占用总运行时间为: 154 /425 ≈ 0.36
最大的内存消耗为91.60MB
Figure 4: concurrent,GC count
Pasted image 20240802194803
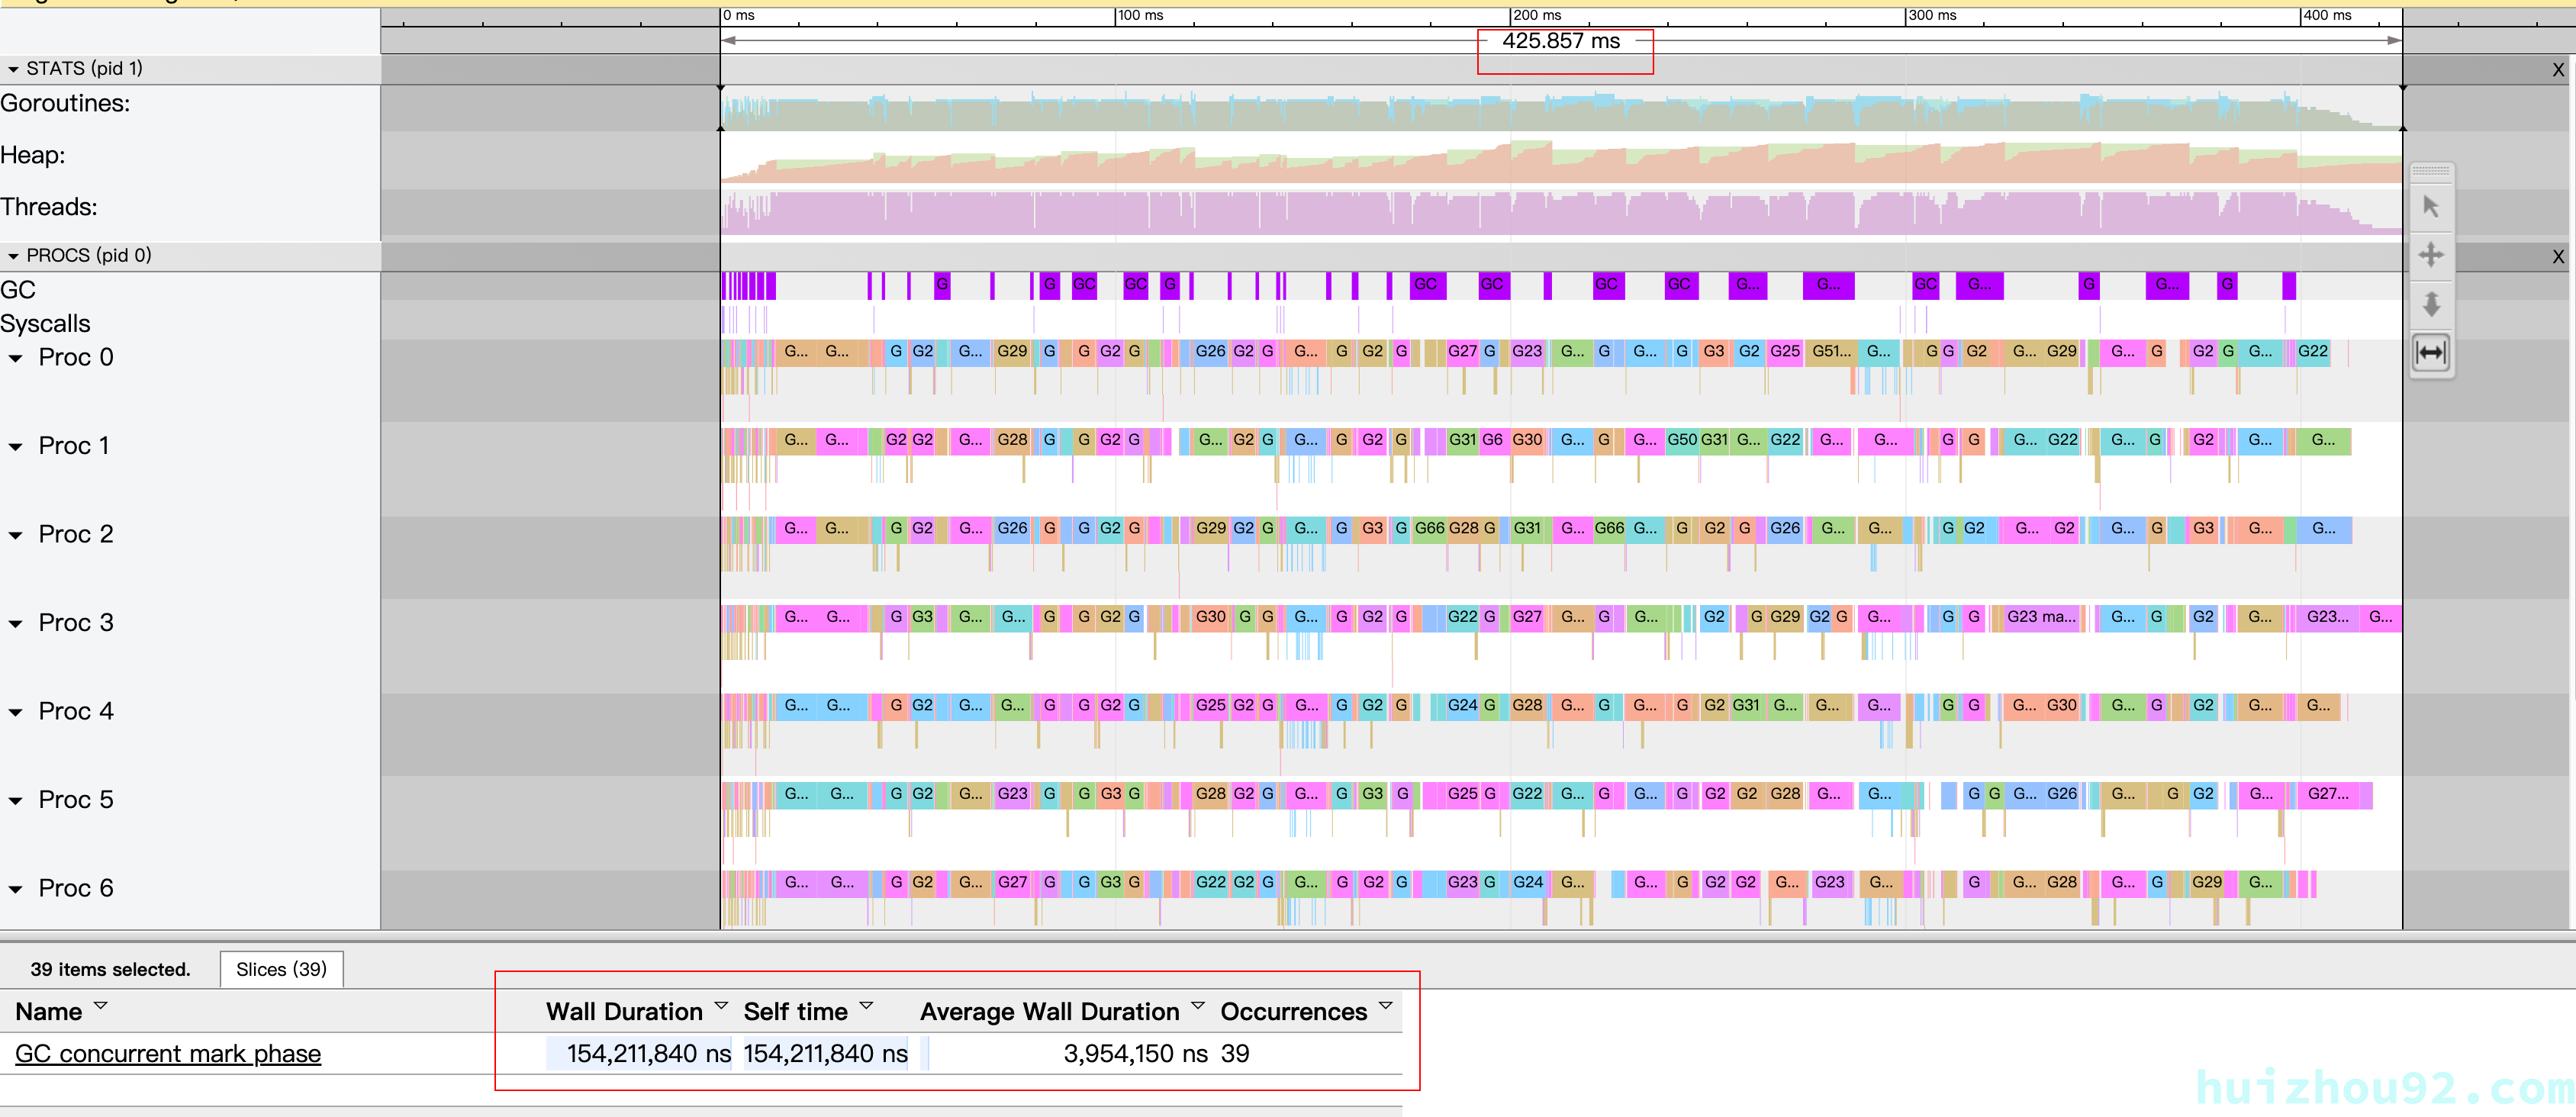
Figure 5: concurrent, Max heap
Pasted image 20240802194902

concurrent 比single 大约快了5倍,在go trace 的结果中,我们可以看到 concurrent 版本中GC占了36%的运行时间。有没有办法能优化这个时间呢?幸运的是在go 1.19 版本中我们有两个参数可以来控制GC。

GOGC & GOMEMLIMIT

在go1.19 中添加了两个参数,可以用它来控制GC,GOGC 用于控制垃圾回收的频率,而 GOMEMLIMIT 用于限制程序的最大内存使用量。关于 GOGCGOMEMLIMIT 详细细节,可以参考官方文档 gc-guide

GOGC

根据官方文档中的这个公式:
$New heap memory = (Live heap + GC roots) * GOGC / 100$

根据官方文档,如果我们将GOGC设置为1000,理论上,会将GC触发的频率降低10倍,代价是内存占用增加十倍。(这只是一个理论模型,实际上很复杂)
试试呗?

1
2
3
➜  go_trace git:(main)time GOGC=1000 ./go_trace 2 > trace_gogc_1000.out
2024/08/05 16:57:29 find key word go 2400 count
GOGC=1000 ./go_trace 2 > trace_gogc_1000.out  2.46s user 0.16s system 757% cpu 0.346 total

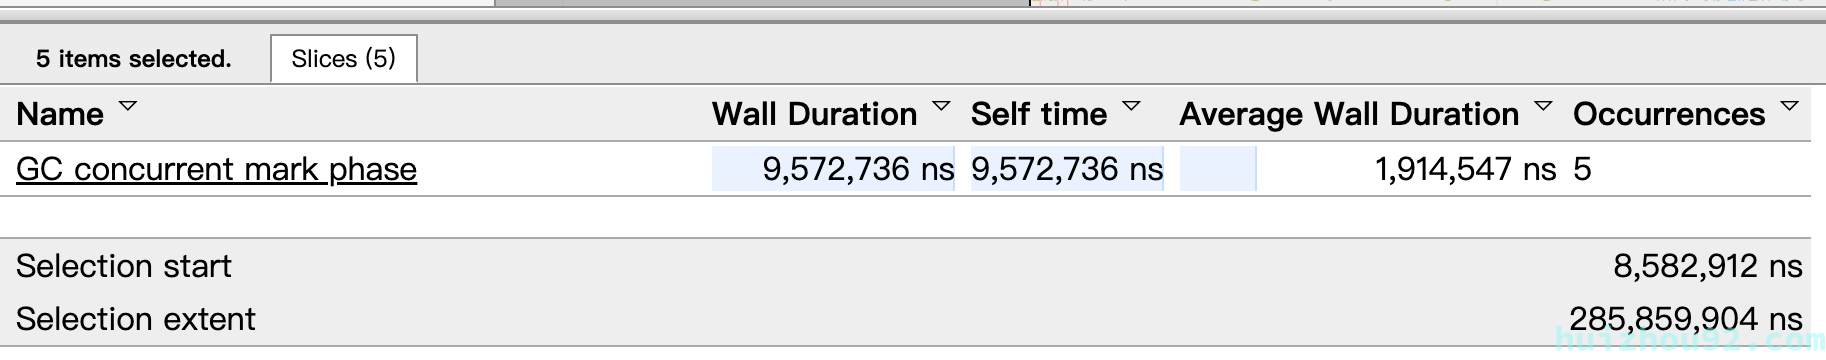
RunTime :314ms, STW: 9.572ms, GC Occurrences: 5, GC STW AVE: 1.194ms
GC 时间 占用总运行时间为: 9.572/314 ≈ 0.02
最大内存占用为 451MB。
Figure 6: GOGC, Max Heap
Pasted image 20240805171630
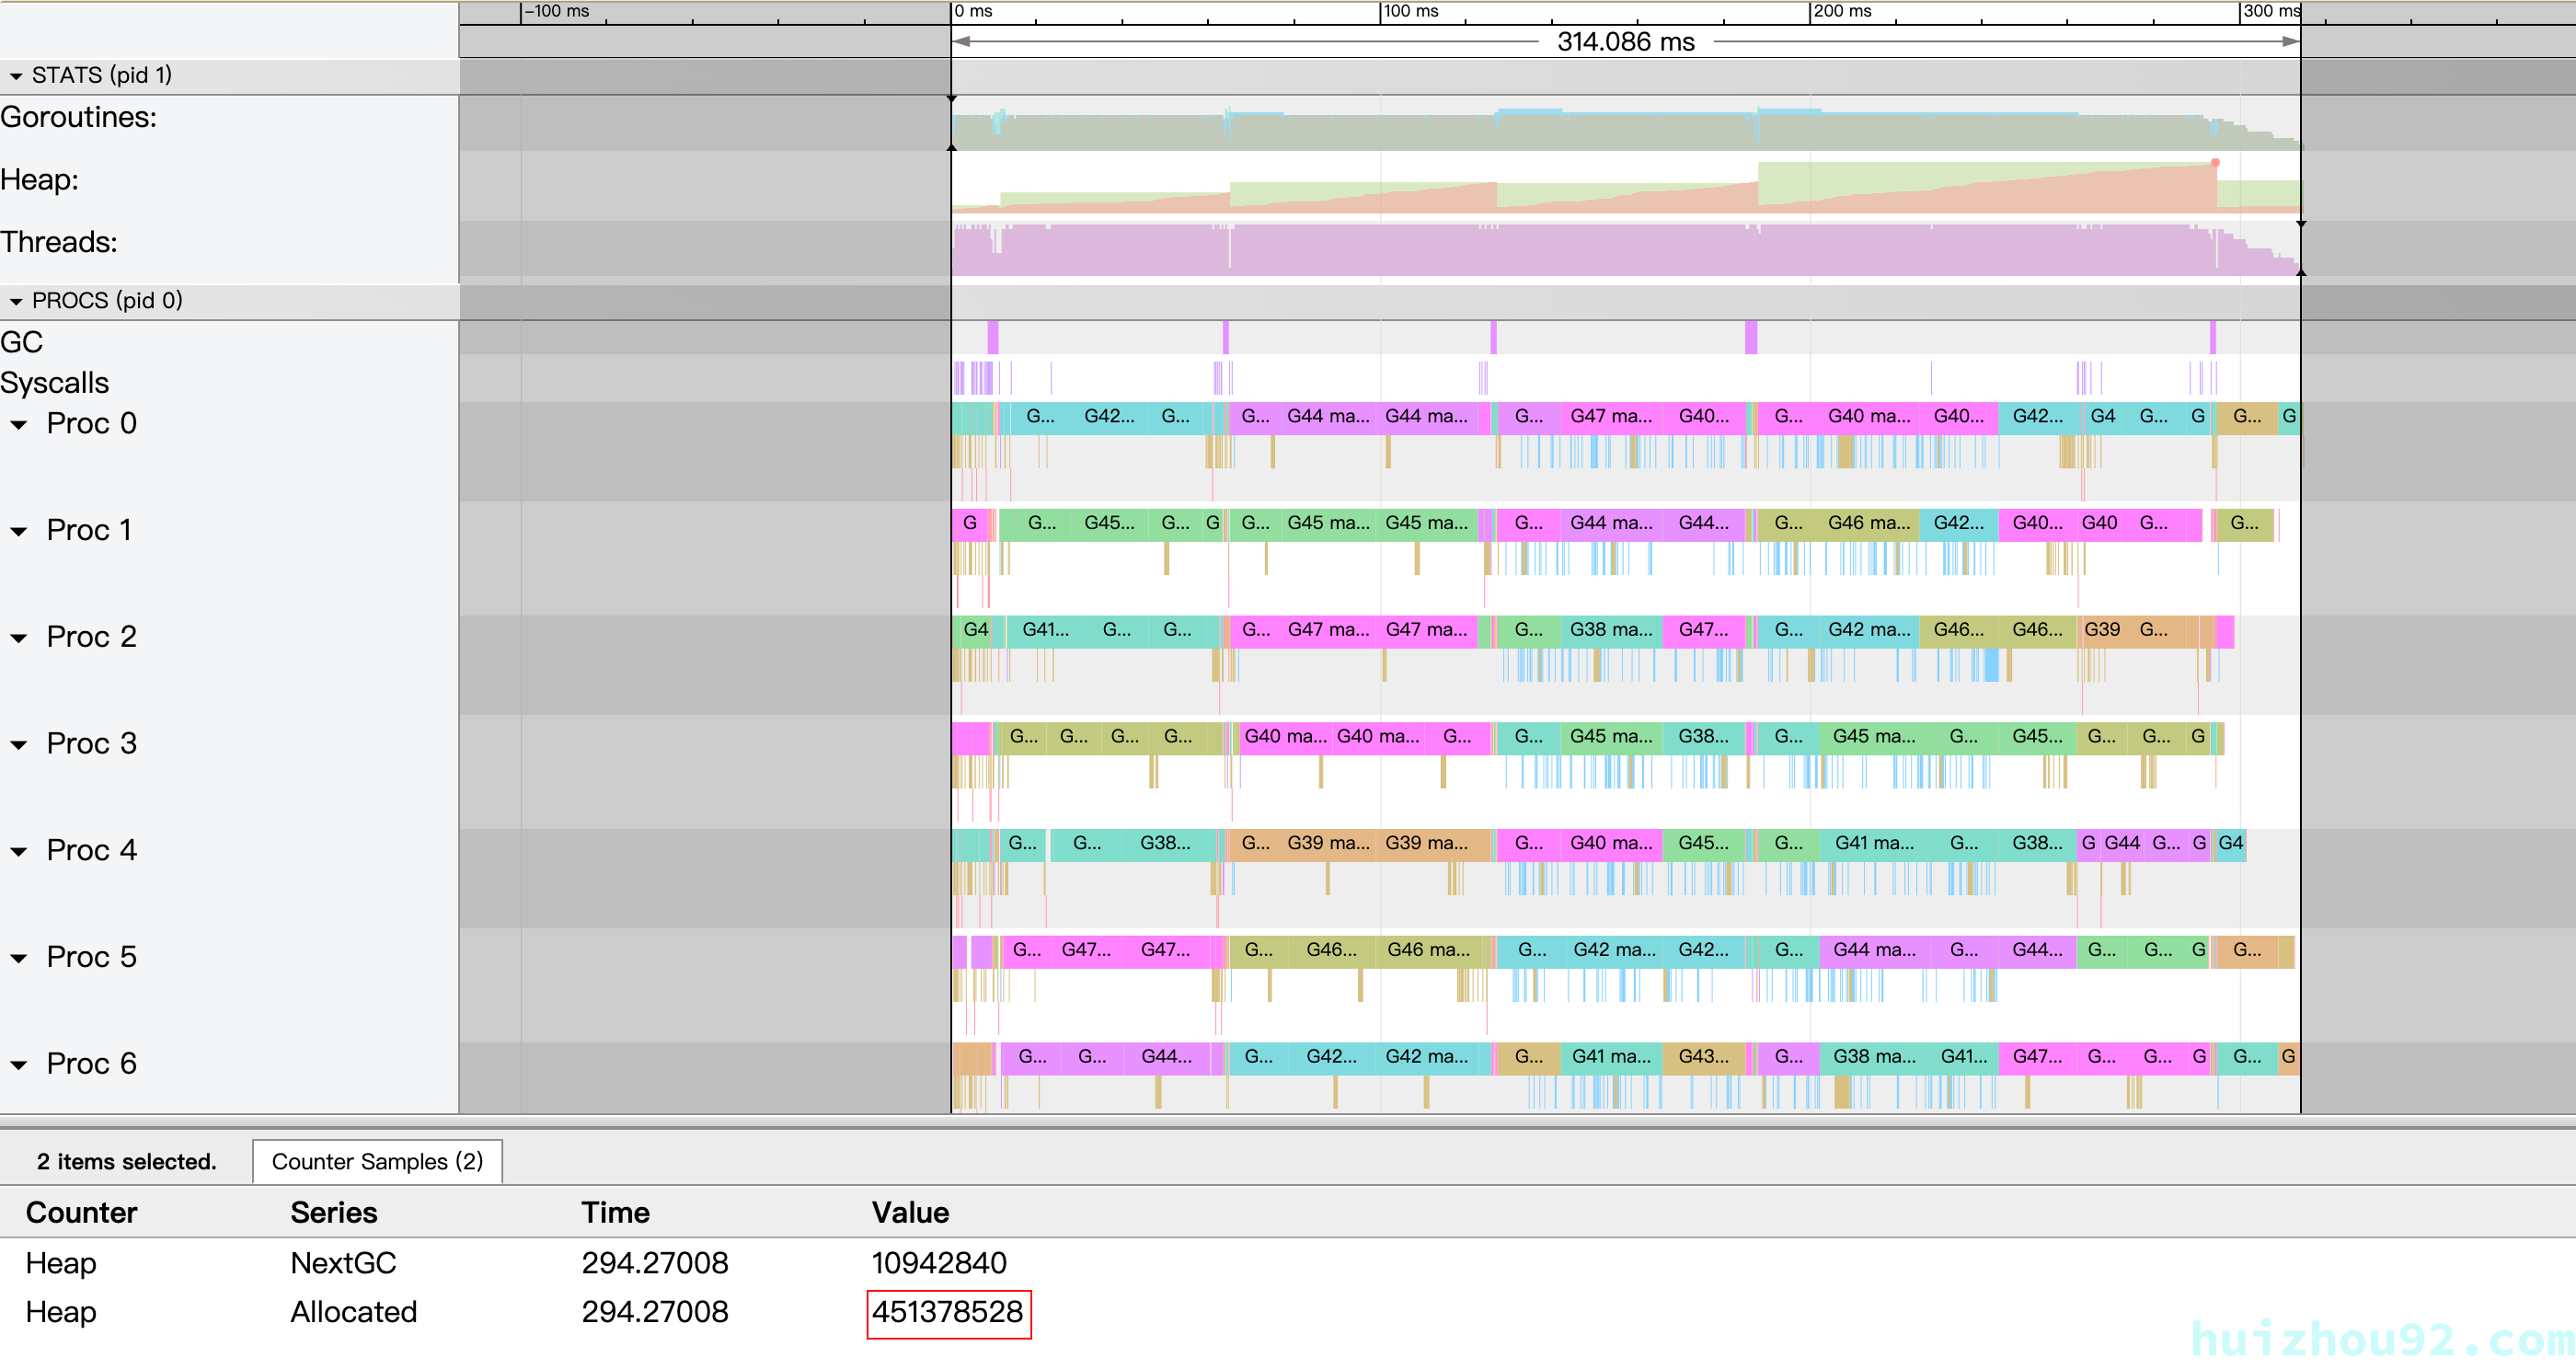
Figure 7: GOGC, GC count
Pasted image 20240805171642

GOMEMLIMIT

GOMEMLIMIT 用来设置程序使用的内存上限,一般在关闭自动GC 的场景下使用,让我们可以手动管理程序占用的内存总数。当程序分配的内存到达上限的时候,会触发GC。需要注意,虽然GC已经很努力的在工作了,程序使用的内存上限,可能还是会超过GOMEMLIMIT 的设定。
在 single 版本中,我们的程序使用了11.28M 内存,concurrent 版本我们有十个协程一起运行,按照 gc-guide 的指导,我们需要预留10%的内存应对突发情况。所以我们可以把GOMEMLIMIT 设置为 11.28MB * 1.1 ≈ 124MB

1
2
3
➜  go_trace git:(main)time GOGC=off GOMEMLIMIT=124MiB ./go_trace 2 > trace_mem_limit.out  
2024/08/05 18:10:55 find key word go 2400 count
GOGC=off GOMEMLIMIT=124MiB ./go_trace 2 > trace_mem_limit.out  2.83s user 0.15s system 766% cpu 0.389 total

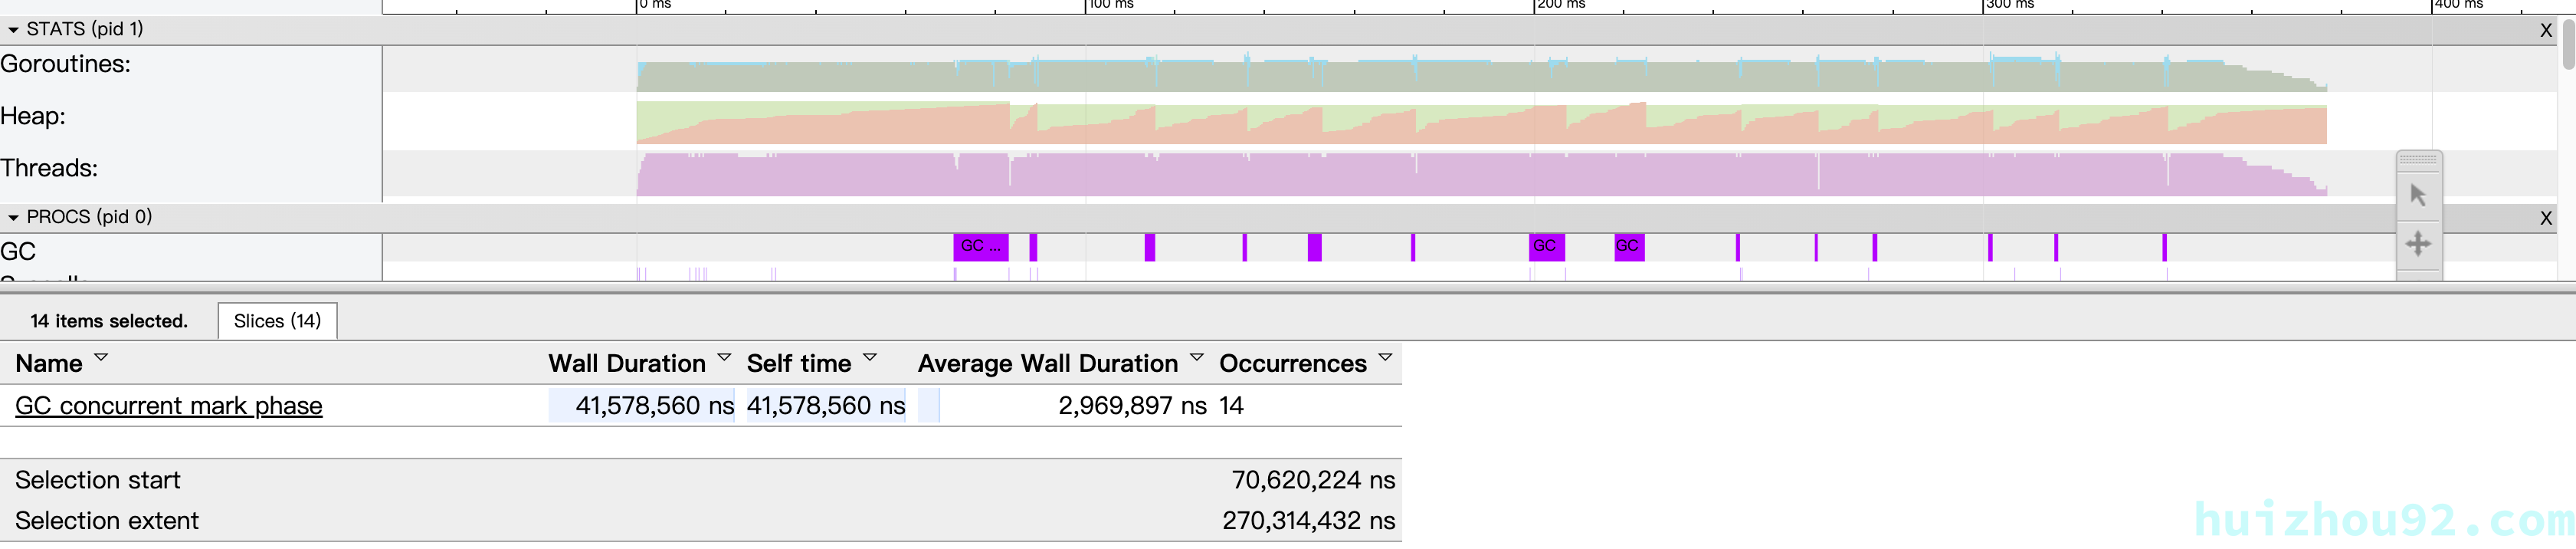
RunTime :376.455 ms, STW: 41.578ms, GC Occurrences: 14, GC STW AVE: 2.969ms
GC 时间 占用总运行时间为: 41.578/376.455 ≈ 0.11
最大内存占用为 120MB,比较接近我们设置的上限。
Figure 8: GOMEMLIMIT, GC Max Heap
Pasted image 20240805181452
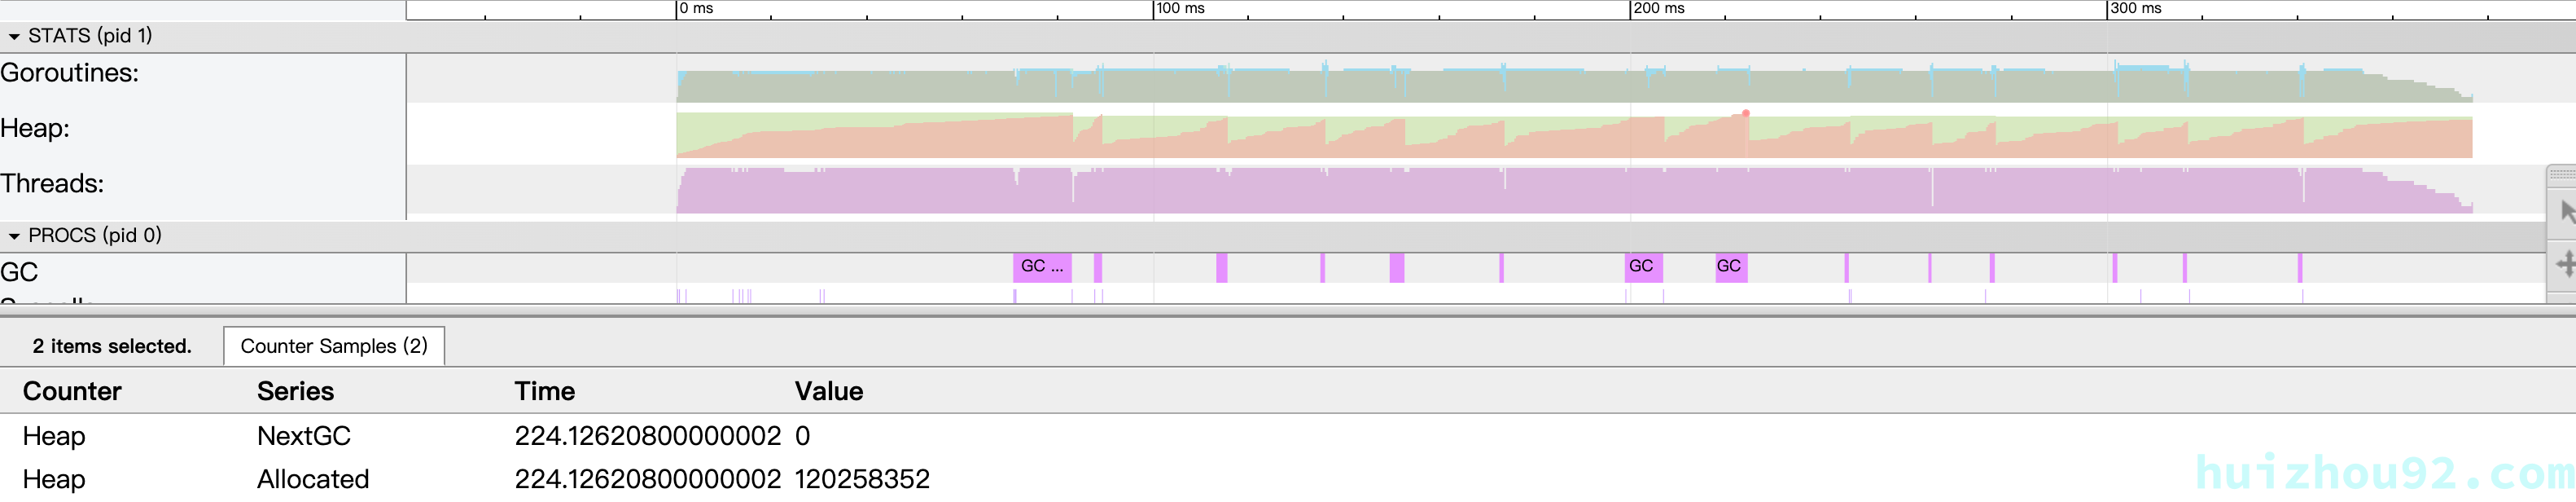
Figure 9: GOMEMLIMIT GC count
Pasted image 20240805181512
如果我们继续增大 GOMEMLIMIT参数,会得到更好的结果,比如GOMEMLIMIT=248Mib 得到的trace 为下图所示
Figure 10: GOMEMLIMIT= 248Mib, GC
Pasted image 20240805183259

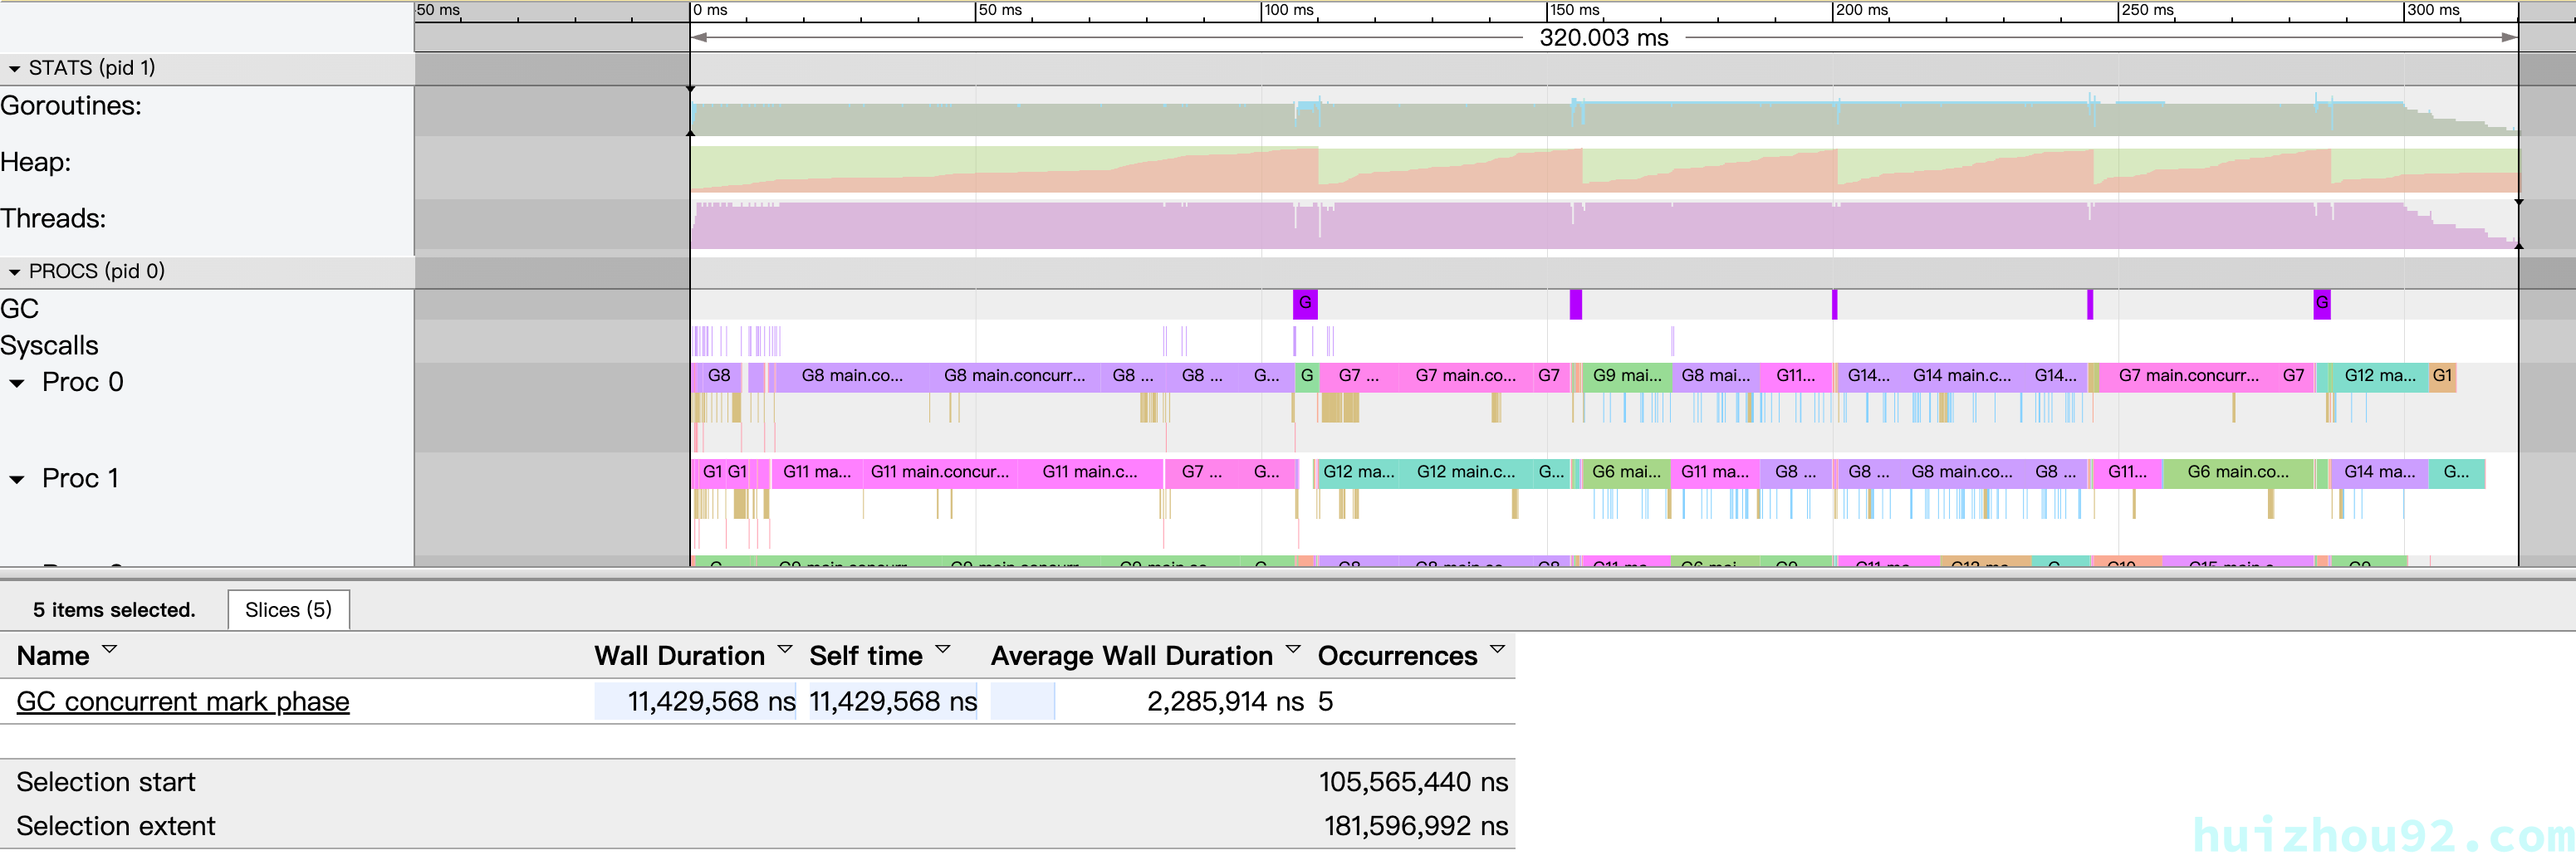
RunTime :320.455 ms, STW: 11.429ms, GC Occurrences: 5, GC STW AVE: 2.285ms
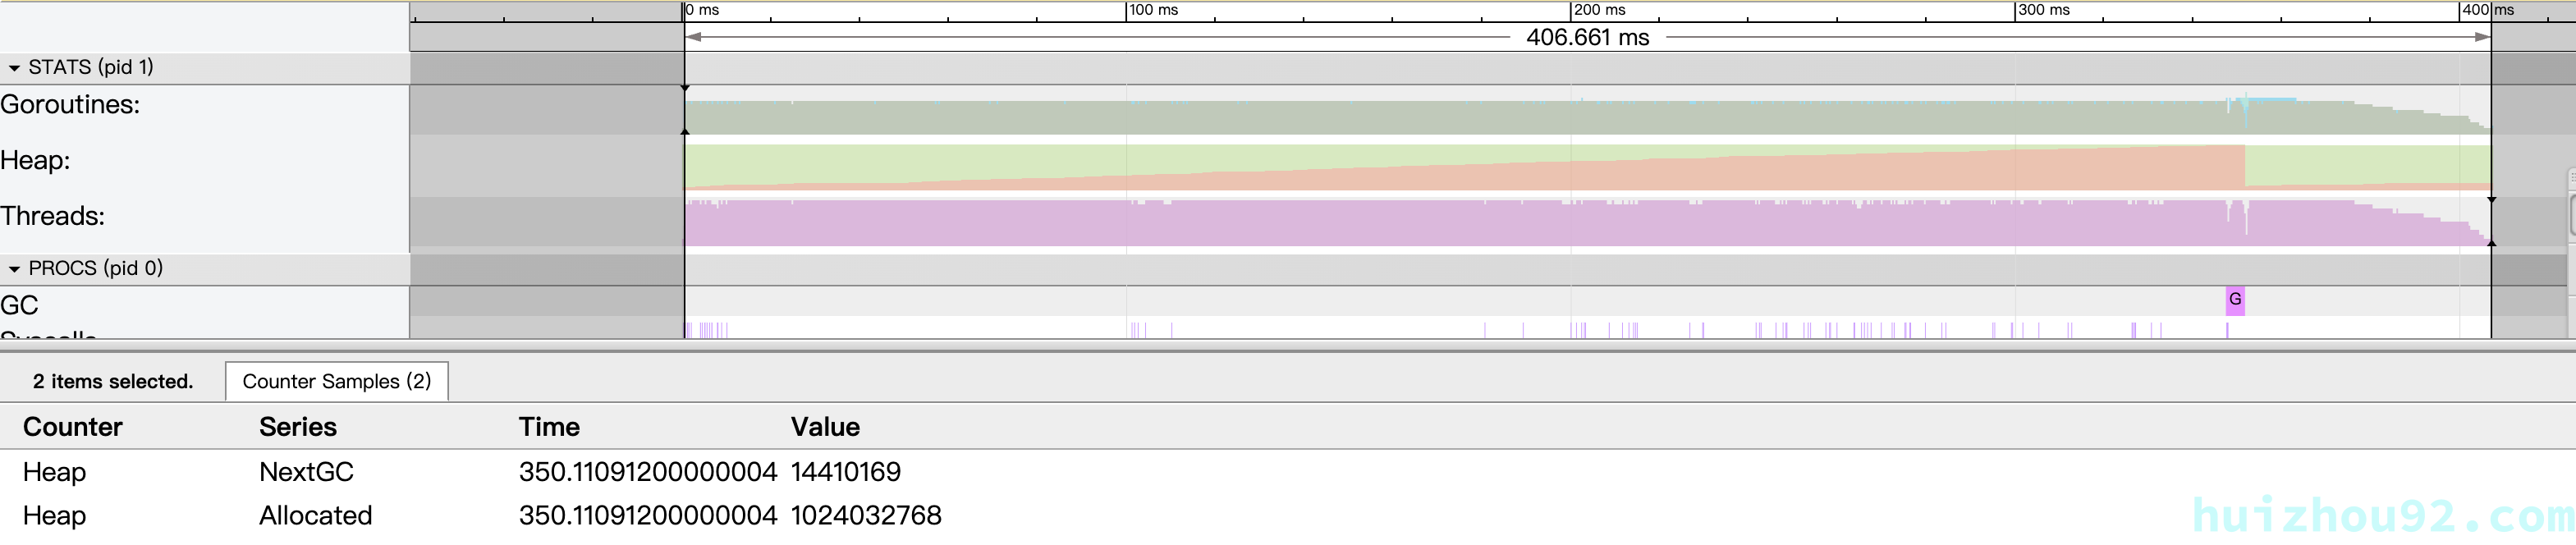
但是他不是没有边界的, 比如 GOMEMLIMIT=1024Mib RunTime 已经到了406ms
Figure 11: GOMEMLIMIT= 1024Mib, GC
Pasted image 20240805183727

风险

Suggested_uses 中已经个给出了很明确的建议,除非对自己的程序的运行环境,面对的负载特别熟悉,否则不要使用这两个参数。请您务必阅读 gc-guide

总结

最后我们总结一下上面的过程优化过程结果
Figure 12: Result Compare
Pasted image 20240805184357

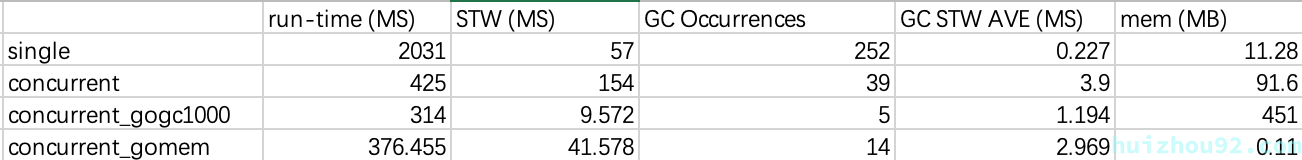
在合适的场景使用GOGC以及GOMEMLIMIT,能够有效的提升性能。并且有一种掌控某种不确定东西的成就感。但是一定要在受控环境中合理应用,以确保性能和可靠性,而在资源共享或不受控制的环境中应谨慎,避免因设置不当导致性能下降或程序崩溃。

参考资料

[1]. https://www.youtube.com/watch?v=PYMs-urosXs&t=2684s
[2]. https://www.uber.com/en-TW/blog/how-we-saved-70k-cores-across-30-mission-critical-services/
[3]. https://tip.golang.org/doc/gc-guide

Licensed under CC BY-NC-SA 4.0
最后更新于 Jun 26, 2024 14:57 CST
使用 Hugo 构建
主题 StackJimmy 设计