
In Go language development, memory leak issues are often challenging to pinpoint. While traditional pprof tools can provide some assistance, their capabilities are limited in complex scenarios. To analyze and resolve these issues more effectively, the CloudWeGo team has developed a new tool called goref.
Based on Delve, goref can deeply analyze heap object references in Go programs, displaying the distribution of memory references to help developers quickly locate memory leaks or optimize garbage collection (GC) overhead. This tool supports the analysis of runtime processes and core dump files, providing Go developers with a powerful memory analysis tool.
Limitations Of pprof
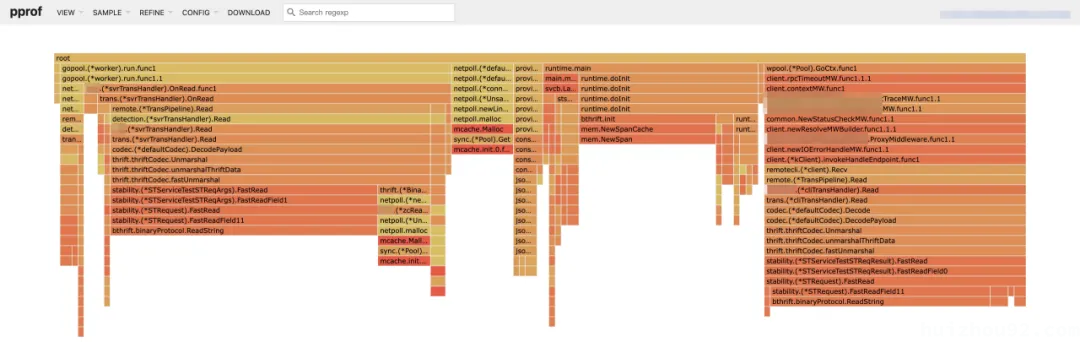
When encountering memory leaks in Go development, most people first attempt to generate a heap profile to investigate the issue. However, the heap profile flame graph often does not provide much help in troubleshooting because it only records where objects are created. In complex business scenarios, where objects are passed through multiple layers of dependencies or reused from memory pools, it becomes nearly impossible to identify the root cause based solely on the stack information of the creation.
For example, in the following heap profile, the FastRead function stack is a deserialization function from the Kitex framework. If a business coroutine leaks a request object, it does not reflect the corresponding leaking code location but only shows that the FastRead function stack occupies memory.
As we know, Go is a garbage-collected language, and an object cannot be released primarily because the GC marks it as alive through reference analysis. Similarly, as a GC language, Java has more sophisticated analysis tools, such as JProfiler, which can effectively display object reference relationships. Therefore, we also wanted to implement an efficient reference analysis tool in Go that can accurately and directly inform us of memory reference distribution and relationships, liberating us from the arduous task of static analysis. The good news is that we have nearly completed the development of this tool, which is open-sourced in the goref repository, with usage instructions available in the README document.
The following sections will share the design ideas and detailed implementation of this tool.
Implementation Ideas of Goref
GC Marking Process
Before discussing the specific implementation, let’s review how the GC marks objects as alive.
Go employs a tiered allocation scheme similar to tcmalloc, where each heap object is assigned to an mspan during allocation, with a fixed size. During GC, a heap address calls runtime.spanOf to find this mspan from a multi-level index, thus obtaining the base address and size of the original object.
|
|
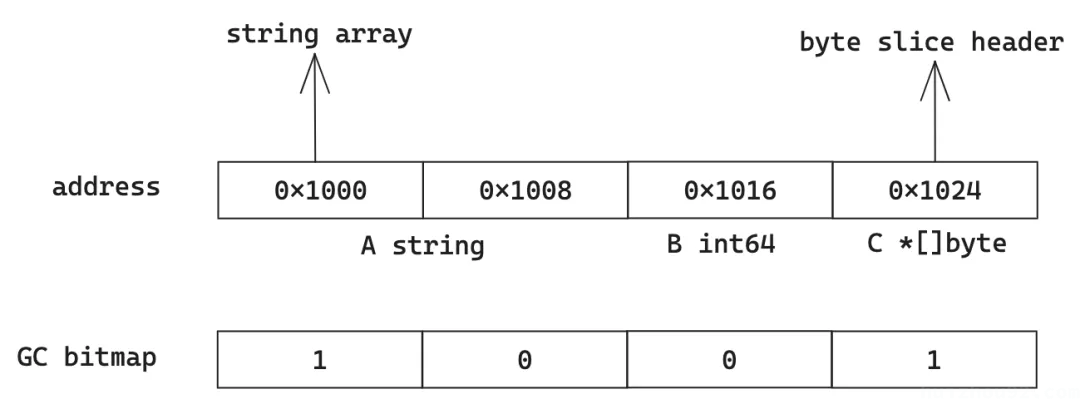
By using the runtime.heapBitsForAddr function, we can obtain a GC bitmap for an object address range. The GC bitmap indicates whether each 8-byte aligned address in the memory of an object is a pointer type, thus determining whether to further mark downstream objects.
For example, consider the following Go code snippet:
|
|
When the GC scans the variable b, it does not simply scan the memory of the B int64 field; instead, it looks up the base and elem size through the mspan index and then scans, marking the memory of fields A and C, as well as their downstream objects, as alive.
When scanning the variable a, the corresponding GC bit is 1001. How should we interpret this? We can consider that the addresses base+0 and base+24 are pointers, indicating that downstream objects should be scanned further. Here, both A string and C *[]byte contain pointers to downstream objects.
Based on the above brief analysis, we can see that to find all live objects, the simple principle is to start from the GC Root and scan the GC bits of each object. If an address is marked as 1, we continue scanning downstream. Each downstream address must determine its mspan to obtain the complete object base address, size, and GC bit.
DWARF Type Information
However, merely knowing the reference relationships of objects is almost useless for troubleshooting, as it does not output any effective variable names or type information for developers to locate issues. Therefore, another crucial step is to obtain the variable names and type information of these objects.
Go is a statically typed language, and objects generally do not directly contain their type information. For instance, when we create an object using obj=new(Object), the actual memory only stores the values of fields A/B/C, occupying only 32 bytes in memory. Given this, how can we obtain type information?
Implementation Of goref
Introduction To Delve Tool
Those who have experience in Go development should be familiar with Delve. If you think you haven’t used it, don’t doubt yourself; the debugging functionality you use in the Goland IDE is fundamentally based on Delve. At this point, you may recall the debugging window during your debugging sessions. Indeed, the variable names, values, and types displayed in the debugging window are precisely the type information we need!
|
|
So, how does Delve obtain this variable information? Delve reads the executable file path from the soft link in /proc/<pid>/exe when we attach it to a process. Go generates debugging information during compilation, stored in sections with the .debug_* prefix in the executable file, following the DWARF standard format. The type of information required for reference analysis for global and local variables can be parsed from this DWARF information.
For global variables, Delve iterates through all DWARF Entries, parsing those with the Variable tag. These Entries contain attributes such as Location, Type, and Name.
- The Type attribute records its type information, which can be recursively traversed in DWARF format to determine the type of each sub-object further.
- The Location attribute is a relatively complex property that records either an executable expression or a simple variable address, serving to determine a variable’s memory address or return a register’s value. During global variable parsing, Delve uses this to obtain the variable’s memory address.
The principle for parsing local variables in goroutines is similar to that of global variables, but it is somewhat more complex. For example, it requires determining the DWARF offset based on the PC, and the location expressions are more complicated, involving register access. We will not elaborate on this here.
Building GC Analysis Metadata
We can also obtain memory access permissions by utilizing Delve’s process attachment and core file analysis capabilities. We mimic the GC marking process for objects, constructing the necessary metadata for the process to be analyzed in the tool’s runtime memory. This includes:
- The address space range of each Goroutine stack in the process to be analyzed, including the
stackmapthat stores the gcmask for each Goroutine stack, used to mark whether it may point to a live heap object. - The address space range of each
data/bsssegment in the process to be analyzed, including thegcmaskfor each segment, is also used to mark whether it may point to a live heap object. - The above two steps are necessary to obtain GC Roots.
- The final step is to read the
mspanindex of the process to be analyzed, along with the base,elemsize,gcmask, and other information for eachmspan, restoring this index in the tool’s memory.
These steps outline the general process, which also involves handling some detail issues, such as dealing with GC finalizer objects and special handling of allocation header features in Go version 1.22, which we will not delve into here.
DWARF Type Scanning
With everything in place, we are ready for the most critical step: object reference relationship analysis.
We call each GC Root variable the findRef function, accessing the object’s memory according to different DWARF types. If it is a pointer that may point to downstream objects, we read the pointer’s value and find this downstream object in the GC metadata. We have obtained the object’s base address, elem size, gcmask, and other information.
If the object is accessed, we record a mark bit to avoid re-accessing the object. By constructing a new variable with the DWARF sub-object type, we recursively call findRef until all known types of objects are confirmed.
However, this reference scanning method is entirely contrary to the GC approach. The main reason is that Go has many unsafe type conversions. For instance, an object created with pointer fields may look like this:
|
|
From the GC’s perspective, although the type has been converted to *byte using unsafe, it does not affect its gcmask marking. Therefore, when scanning downstream objects, we can still scan the complete Object object and identify the bytes downstream object, marking it as alive.
However, DWARF type scanning cannot achieve this. When it encounters the byte type, it will consider it a non-pointer object and skip further scanning. Thus, the only solution is to prioritize DWARF type scanning, and for objects that cannot be scanned, we will use the GC method to mark them.
To implement this, whenever we access a pointer to an object using DWARF types, we will mark its corresponding gcmask from 1 to 0. After scanning an object, if there are still non-zero marked pointers within the object’s address space, we will record them for final marking tasks. Once all objects have been scanned using DWARF types, we will extract these final marking tasks and perform a secondary scan using the GC method.
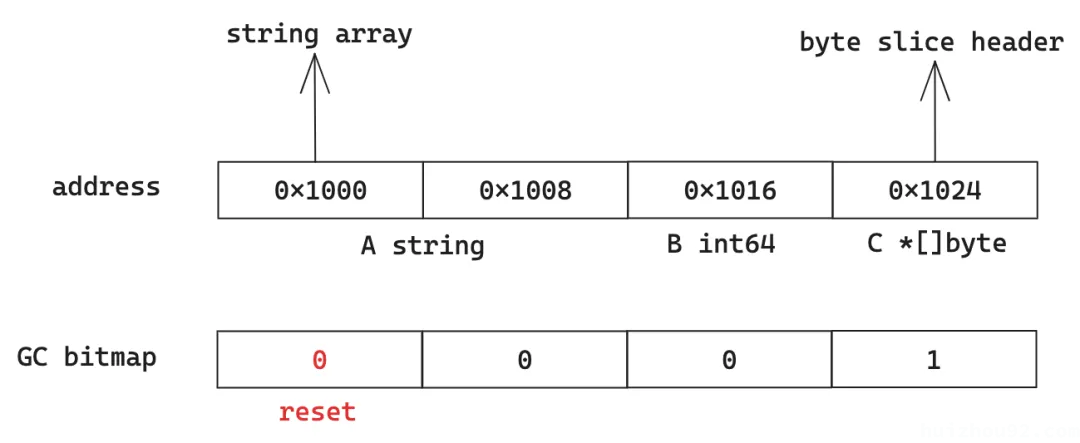
For example, when accessing the aforementioned Object, its gcmask is 1010. After reading field A, the gcmask changes to 1000. If field C is not accessed due to type conversion, it will be included in the final scan during GC marking.
In addition to type conversion, memory out-of-bounds references are also common issues. For instance, in the example code var b *int64 = &echo().B, fields A and C belong to memory that cannot be scanned using DWARF types and will also be counted during the final scan.
Final Scan
The fields that were type-converted or could not be accessed due to exceeding the DWARF-defined address range, as well as variables like unsafe.Pointer whose types cannot be determined, will all be marked during the final scan. Since these objects cannot be assigned specific types, we only need to record their size and count in the known reference chain.
In Go’s native implementation, many commonly used libraries utilize unsafe.Pointer, leading to issues with sub-object identification. These types require special handling.
Output File Format
After scanning all objects, the reference chains, object counts, and object memory spaces are output to a file, aligned with the pprof binary file format and encoded using protobuf.
-
Root Object Format:
- Stack Variable Format: Package name + Function name + Stack variable name
github.com/cloudwego/kitex/client.invokeHandleEndpoint.func1.sendMsg - Global Variable Format: Package name + Global variable name
github.com/cloudwego/kitex/pkg/loadbalance/lbcache.balancerFactories
- Stack Variable Format: Package name + Function name + Stack variable name
-
Sub-object Format:
- Outputs the type name of the sub-object, such as:
net.Conn; - If it is a map key or value field, it is output in the form of
$mapkey. (type_name)or$mapval. (type_name); - If it is an element of an array, it is output in the format
[0]. (type_name); for elements greater than or equal to 10, it is output as[10+]. (type_name);
- Outputs the type name of the sub-object, such as:
Effect Demonstration
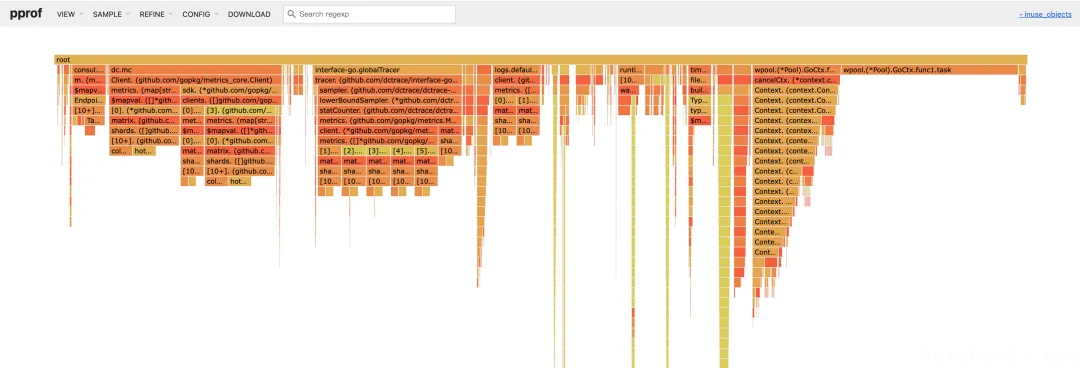
Below is a flame graph of object references sampled from a real business using the tool:
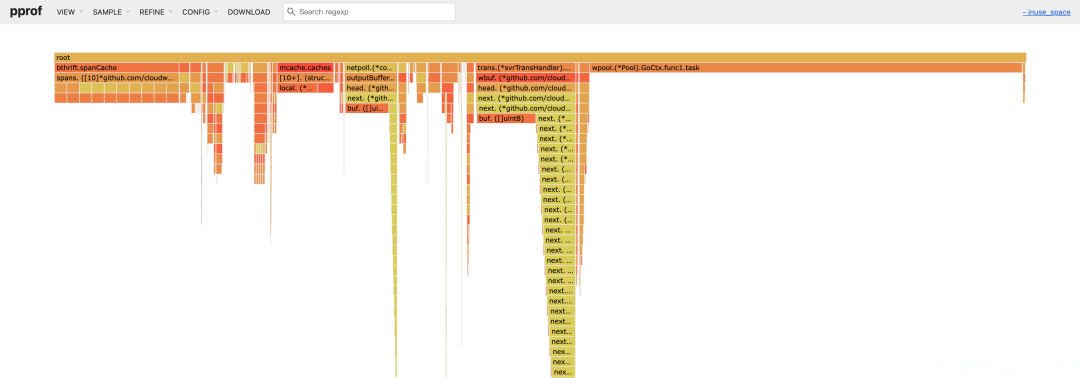
The graph displays the names of each root variable, along with the names and types of the fields they reference. Note: Due to the lack of support for closure type field offsets in DWARF Info before Go 1.23, the closure variable wpool.(*Pool).GoCtx.func1.task cannot currently display downstream objects.
By selecting the inuse_objects tag, you can also view the flame graph of object count distribution:
- Long Time Link
- If you find my blog helpful, please subscribe to me via RSS
- Or follow me on X
- If you have a Medium account, follow me there. My articles will be published there as soon as possible.