The process is one of the great inventions of the operating system, which shields application programs from hardware details such as CPU scheduling and memory management, abstracting the concept of a process, allowing applications to focus on implementing their business logic, and “simultaneously” performing many tasks on a limited CPU. However, while it brings convenience to users, it also introduces some additional overhead. As shown in the figure below, during the running time of a process, although the CPU is busy, it does not complete any user work, which is the additional overhead brought by the process mechanism.
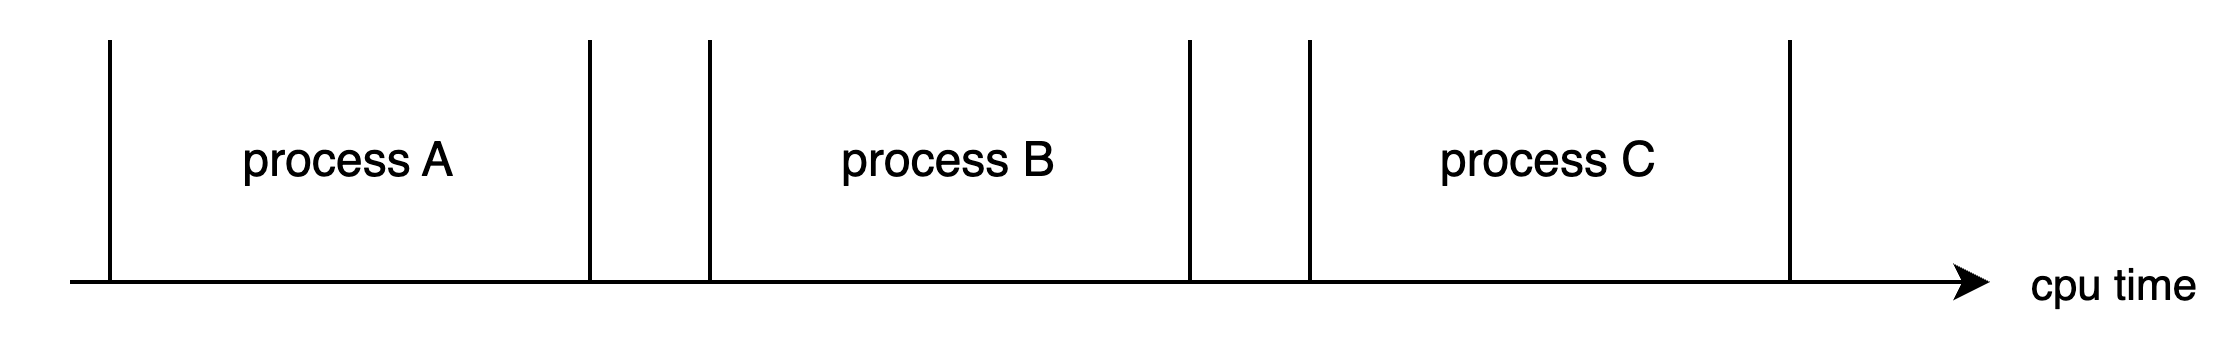
During the process switch from process A to process B, first save the context of process A so that when A resumes running, it knows what the next instruction of process A is. Then, restore the context of process B to the register. This process is called a context switch. The context switch overhead is not significant in scenarios with few processes and infrequent switches. However, now the Linux operating system is used in high-concurrency network backend servers. When a single machine supports thousands of user requests, this overhead needs to be addressed. Because user processes are blocked by network I/O such as Redis, Mysql data, or when the process time slice is up, it will trigger a context switch.
A Simple Experiment on Process Context Switch Overhead
Without further ado, let’s conduct an experiment to see how long it takes for a context switch! The experimental method is to create two processes and transfer a token between them. One process will be blocked when reading the token, and the other process will be blocked when waiting for its return. After back-and-forth transmission for a certain number of times, we can then calculate their average single-switch time overhead.
|
|
The time for each execution may vary, but the average time for each context switch is around 3.5 microseconds. Of course, this number varies depending on the machine, and it is recommended to test it on real hardware.
When we tested system calls earlier, the minimum value was 200 nanoseconds. It can be seen that the context switch overhead is greater than the system call overhead. While a system call only switches from user mode to kernel mode within the process and then switches back, a context switch directly switches from process A to process B. Obviously, this context switch requires more work to be done.
{{}}
Types of Overhead in Process Context Switching
So what specific CPU overheads are involved in context switching? Overheads can be divided into two types: direct overhead and indirect overhead.
Direct overhead includes tasks that the CPU must perform during the switch, including:
-
- Switching the page table global directory.
-
- Switching the kernel stack.
-
- Switching hardware contexts (all data to be loaded into registers before the process resumes, collectively referred to as hardware context)
- ip(instruction pointer): points to the next instruction being executed
- bp(base pointer): used to store the stack bottom address of the executing function’s stack frame
- sp(stack pointer): used to store the stack top address of the executing function’s stack frame
- cr3: Page Directory Base Register, stores the physical address of the page directory table
- ……
-
- Refreshing TLB.
-
- Execution of the system scheduler’s code.
Indirect overhead mainly refers to the fact that when switching to a new process, due to various caches not being hot, the speed of execution will be slower. If the process is always scheduled on the same CPU, it’s somewhat better, but if it crosses CPUs, the previously warmed TLB, L1, L2, L3 caches become useless because the running process has changed, leading to more memory IO penetrations for the new process. In fact, our previous experiment did not measure this situation well, so the actual context switch overhead may be greater than 3.5 microseconds.
For students who want to understand the detailed operation process, please refer to Chapter 3 and Chapter 9 of “Understanding the Linux Kernel.”
A More Professional Testing Tool - Lmbench
lmbench is an open-source benchmark for evaluating system performance on multiple platforms, which can test various aspects of performance including document reading and writing, memory operations, process creation and destruction overhead, and networking. The usage is simple, but it runs a bit slow. Interested students can try it out themselves.
The advantage of this tool is that it conducts multiple experiments, each with 2 processes, 8 processes, and 16 processes. The size of data used by each process also varies, fully simulating the impact of cache misses. I used it for testing and the results are as follows:
|
|
lmbench shows that the process context switch time ranges from 2.7 microseconds to 5.48 microseconds.
Thread Context Switching Time
Previously, we tested the overhead of process context switching, now let’s continue to test threads in Linux. Let’s see if threads can be faster than processes, and if so, how much faster.
In Linux, there are actually no threads, but just to cater to developers’ taste, a lightweight process was created and called a thread. Like processes, lightweight processes also have their own independent task_struct process descriptors and their own independent PIDs. From the perspective of the operating system, there is no difference in scheduling between threads and processes; they are just selecting a task_struct from the waiting queue to switch to the running state. The only difference between lightweight processes and regular processes is that lightweight processes can share the same memory address space, code segment, global variables, and the same set of open files.
For threads in the same process, the PID seen by
getpid()is actually the same, but there is atgidfield in the task_struct. For multi-threaded programs, whatgetpid()system call actually gets is thistgid, so multiple threads belonging to
the same process appear to have the same PID.
We’ll use an experiment to test this test06. The principle is similar to the process test. We create 20 threads and use a pipe to pass signals between them. When a signal is received, it will wake up, then pass the signal to the next thread, and sleep by itself. In this experiment, we separately considered the additional overhead of passing signals through the pipe and calculated it in the first step.
|
|
The results may vary each time, and the above results are averages of multiple runs. The approximate time for each thread switch is around 3.8 microseconds. From the perspective of context switch time, Linux threads (lightweight processes) are actually not much different from processes.
Linux Related Commands
Now that we know the CPU time consumed by context switching, how can we check how many switches are happening in Linux? If context switches are affecting the overall system performance, is there a way to identify problematic processes and optimize them?
|
|
or
|
|
The above environment is a production machine with a configuration of 8 cores and 8GB of KVM virtual machine, running nginx+fpm. There are about 100 user interface requests processed per second on average. The cs column in the above output indicates the number of context switches that occurred in 1 second, and it’s about 40,000 times per second. Roughly estimating, each core needs to switch about 5,000 times per second, which means nearly 20 milliseconds are spent on context switching per second. Considering this is a virtual machine, there are some additional overheads in virtualization, and it also consumes CPU for user interface logic processing, system call kernel logic processing, networking, and soft interrupt processing, so a 20ms overhead is not low.
So, further, let’s see which processes are causing frequent context switches?
|
|
Because fpm operates in synchronous blocking mode, most of the switches are voluntary, with fewer involuntary switches occurring only when the time slice expires.
If you want to see the total context switch situation of a specific process, you can directly check it under the /proc interface, but this is the total value.
|
|
Conclusion
- We don’t need to remember exactly what the context switch does, just remember one conclusion: the context switch overhead on my working machine is about 2.7-5.48 microseconds, you can test it on your own machine using the code or tools I provided.
- You can use
vmstatsarand other tools to view the context switches of processes and then locate performance issues. - lmbench is relatively more accurate because it considers the additional overhead caused by cache misses after the switch.
- Long Time Link
- If you find my blog helpful, please subscribe to me via RSS
- Or follow me on X
- If you have a Medium account, follow me there. My articles will be published there as soon as possible.