Today, I will introduce some commonly used commands and tools for viewing Go assembly code and debugging Go programs. These tools can be used in regular situations when engaging with colleagues or in online discussions, allowing you to have an upper hand in critical moments.
This article was first published in the Medium MPP plan. If you are a Medium user, please follow me on Medium. Thank you very much.
For example, if a colleague claims that the first piece of code is more efficient than the second one:
|
|
|
|
and they explained it in such a way that you couldn’t win the argument. What should you do? Just use a single command to generate the assembly code and expose their argument, giving them a reality check.
Generating Assembly Code with Go Tool
In fact, it’s quite simple. There are two commands that can achieve this:
|
|
or:
|
|
The first one is for compilation, which means compiling the source code into an .o object file and outputting the corresponding assembly code.
The second one is for disassembling, which means decompiling the executable file into assembly code. Therefore, you need to compile the code into an executable file using the go build command first.
Although these two commands are not identical, they both reveal that the assembly code generated for the two example code snippets is the same. Your colleague’s “claims” falls apart, and you’ve got them cornered.
Locating the Runtime Source Code
Go is a language with a runtime. What is the runtime? It’s essentially a set of auxiliary programs that the user didn’t write. The runtime writes code for us, such as the Go scheduler.
All we need to know is that we can create goroutines using the go keyword, and then we can pile up our business logic. As for how goroutines are scheduled, we don’t need to worry about it at all because that’s the job of the runtime scheduler.
But how can we correlate our code with the code inside the runtime?
The methods mentioned earlier can achieve this by adding a grep command.
For example, if I want to know which function in the runtime corresponds to the go keyword, I can write a test code snippet:
|
|
Since the line go func() { }() is on line 4, we can add a condition when using grep:
|
|
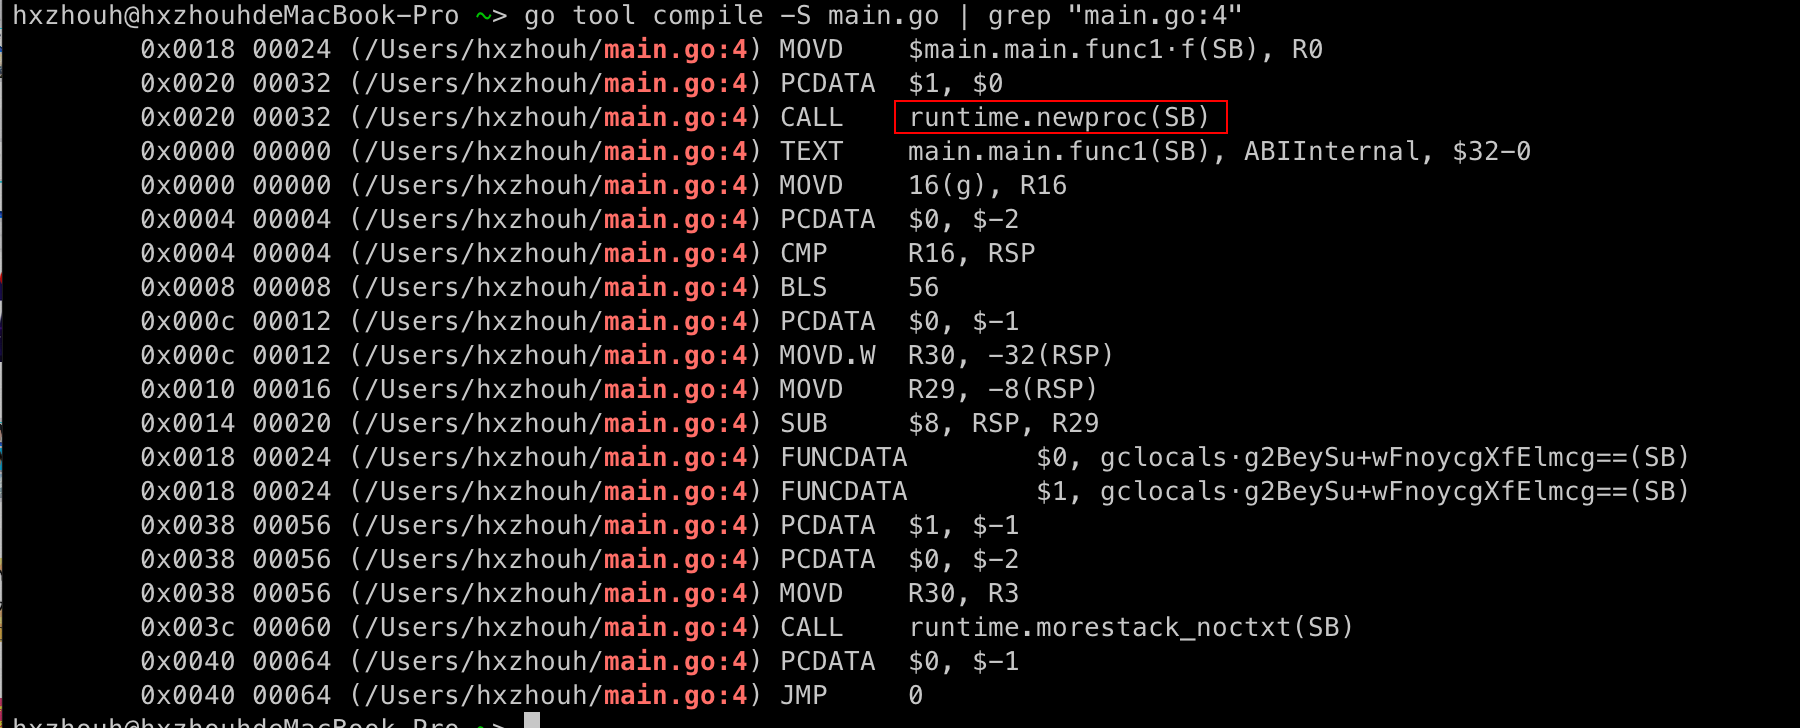
By analyzing the code, we can immediately see that the line go func(){} corresponds to the newproc() function. By further studying the newproc() function, we can gain a better understanding of how goroutines are created.
Debugging Code with Dlv
Some may ask, “Are there any other methods or tools available for debugging Go programs and interacting with them?” The answer is yes! That’s where the dlv debugging tool comes in. It currently provides the best support for debugging Go programs.
Previously, I hadn’t really explored it in-depth and only knew some very basic commands. However, this time I have learned a few advanced commands, which have significantly enhanced my understanding of Go.
Let’s demonstrate how to use dlv with a specific task.
We know that appending elements to a nil slice will not cause any problems. However, if we try to insert new elements into a nil map, it will immediately panic. Why does this happen and where exactly does the panic occur?
First, let’s write a sample program that triggers a panic in a map:
|
|
Next, compile the program and generate an executable file using the go build command:
|
|
Then, enter the debugging mode using dlv:
|
|
To set a breakpoint, we can use the b command in three different ways:
b+ addressb+ line numberb+ function name
Let’s set a breakpoint at the line where the map assignment occurs, which is line 5. We’ll add a breakpoint at that line:
|
|
Use the c command to directly run until the breakpoint is reached. Then, execute the disass command to see the assembly instructions:
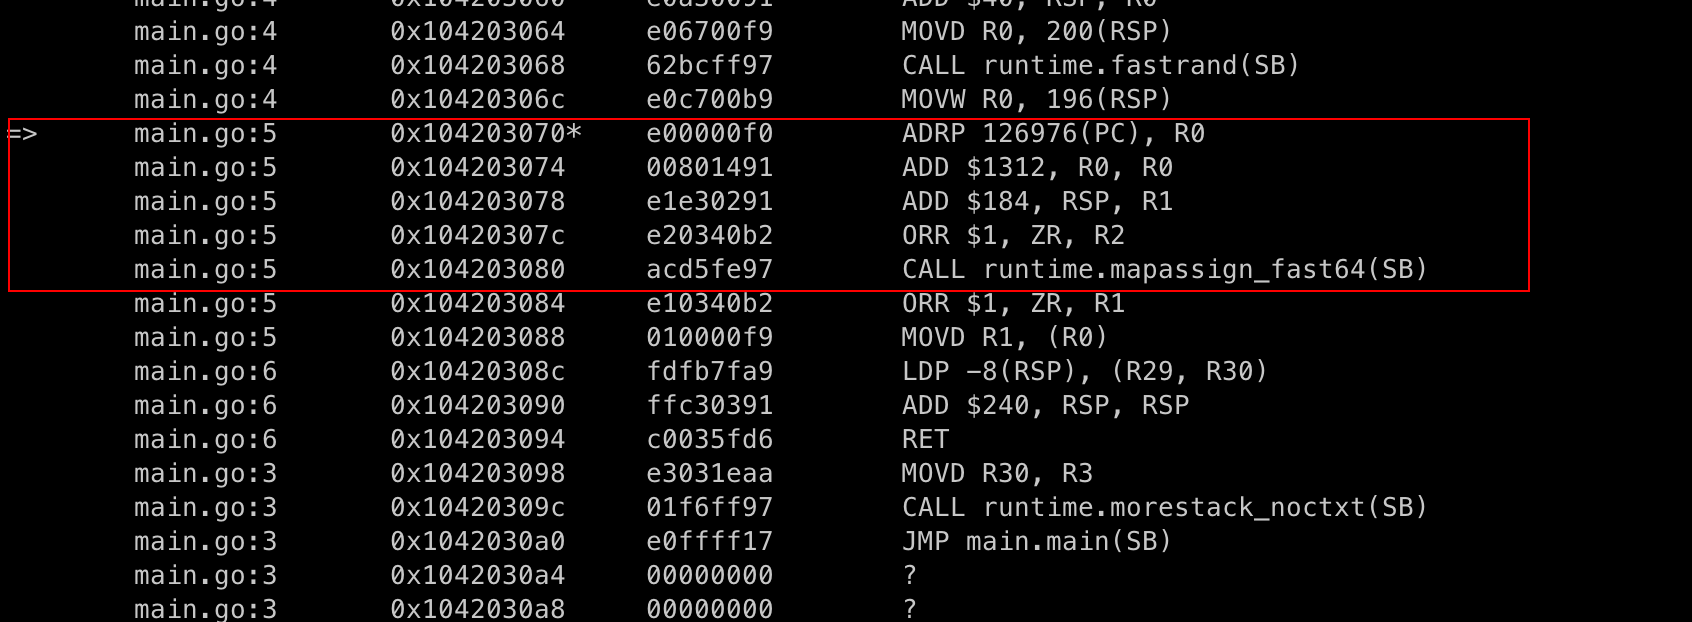
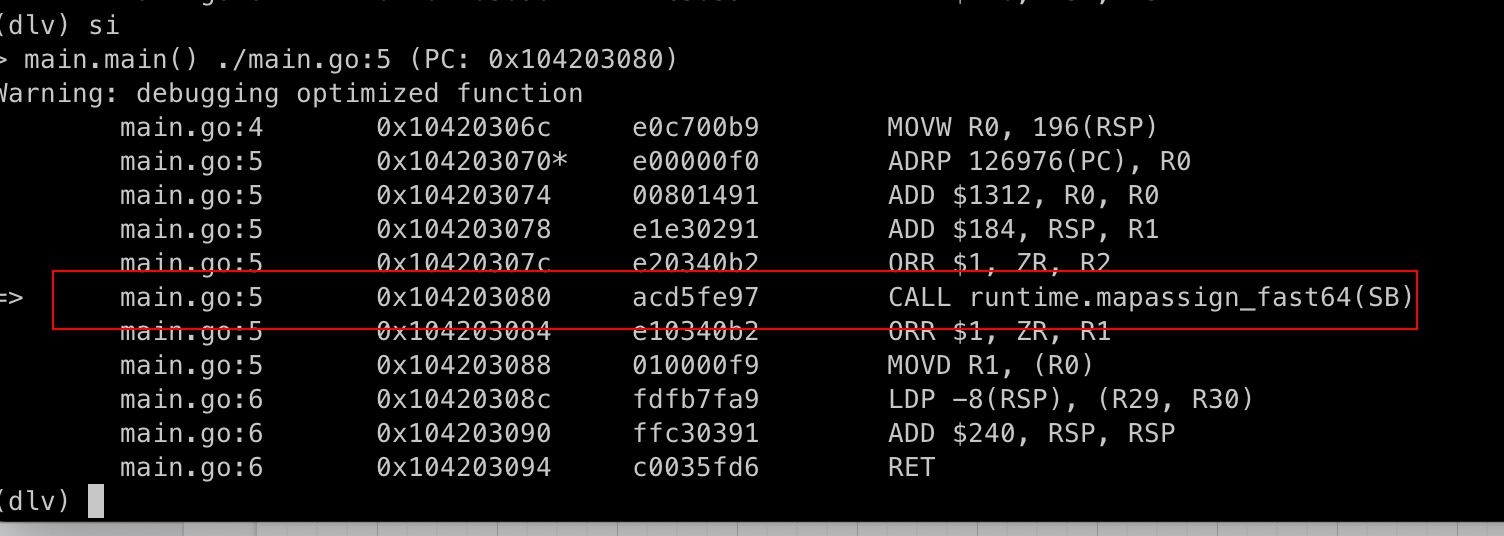
Next, use the si command to execute a single instruction. Repeat the si command to execute until the mapassign_fast64 function is reached:
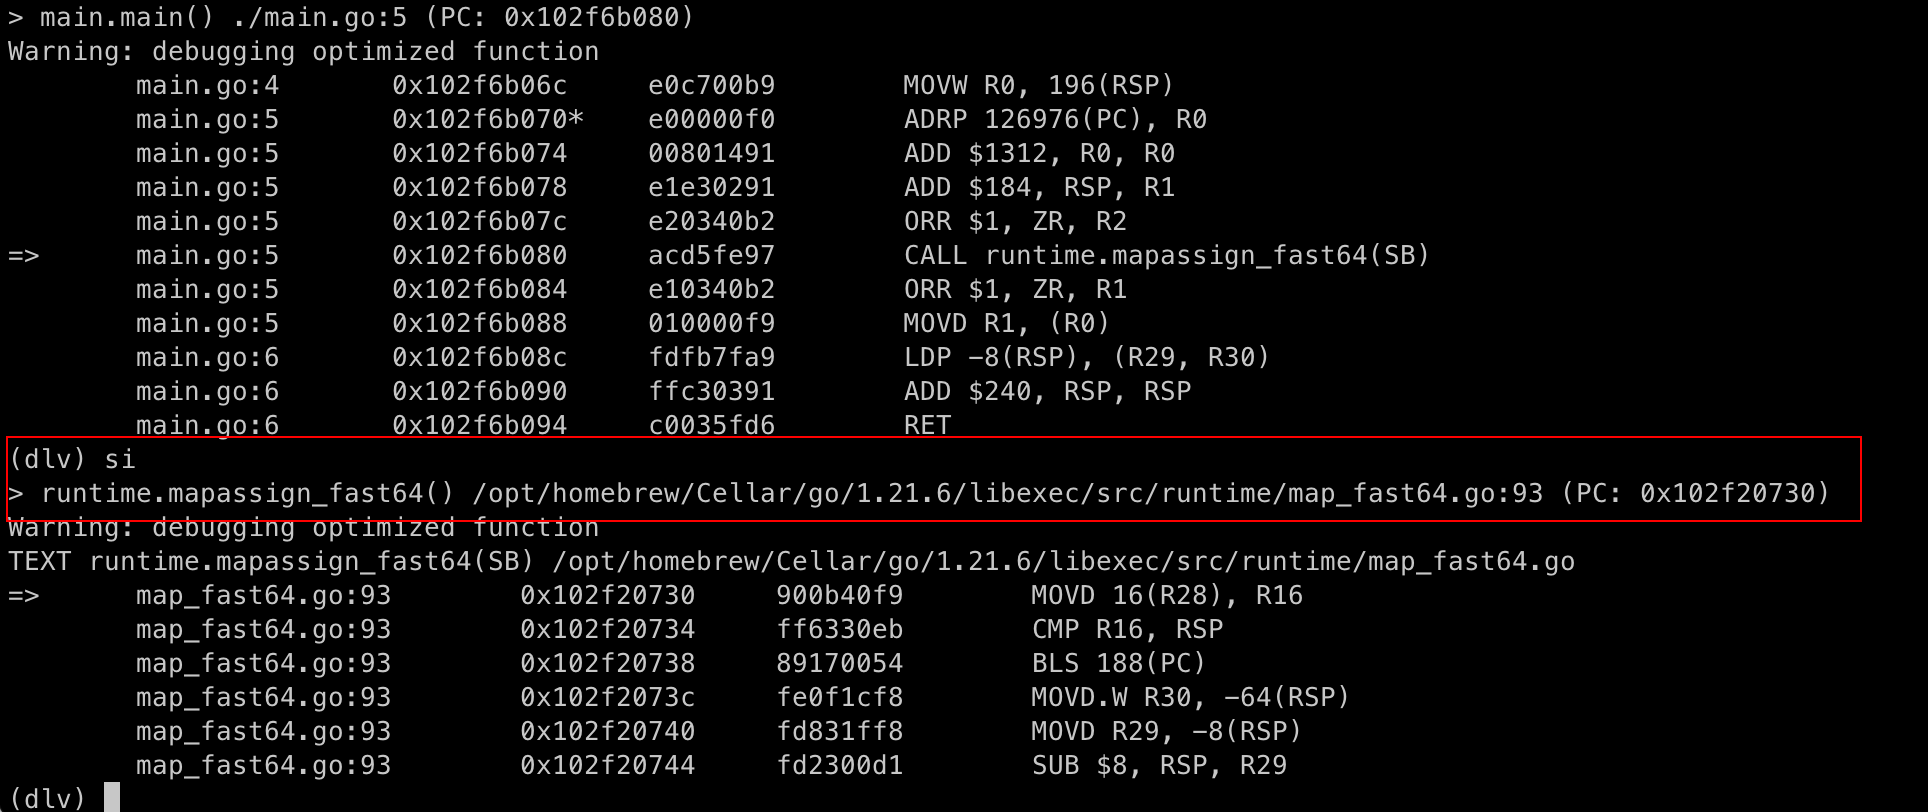
Then, let’s set a breakpoint in the map_fast64.go file:
|
|
Now, by using the s command, we can step into the branch where h is checked for nil and then the panic function is executed:
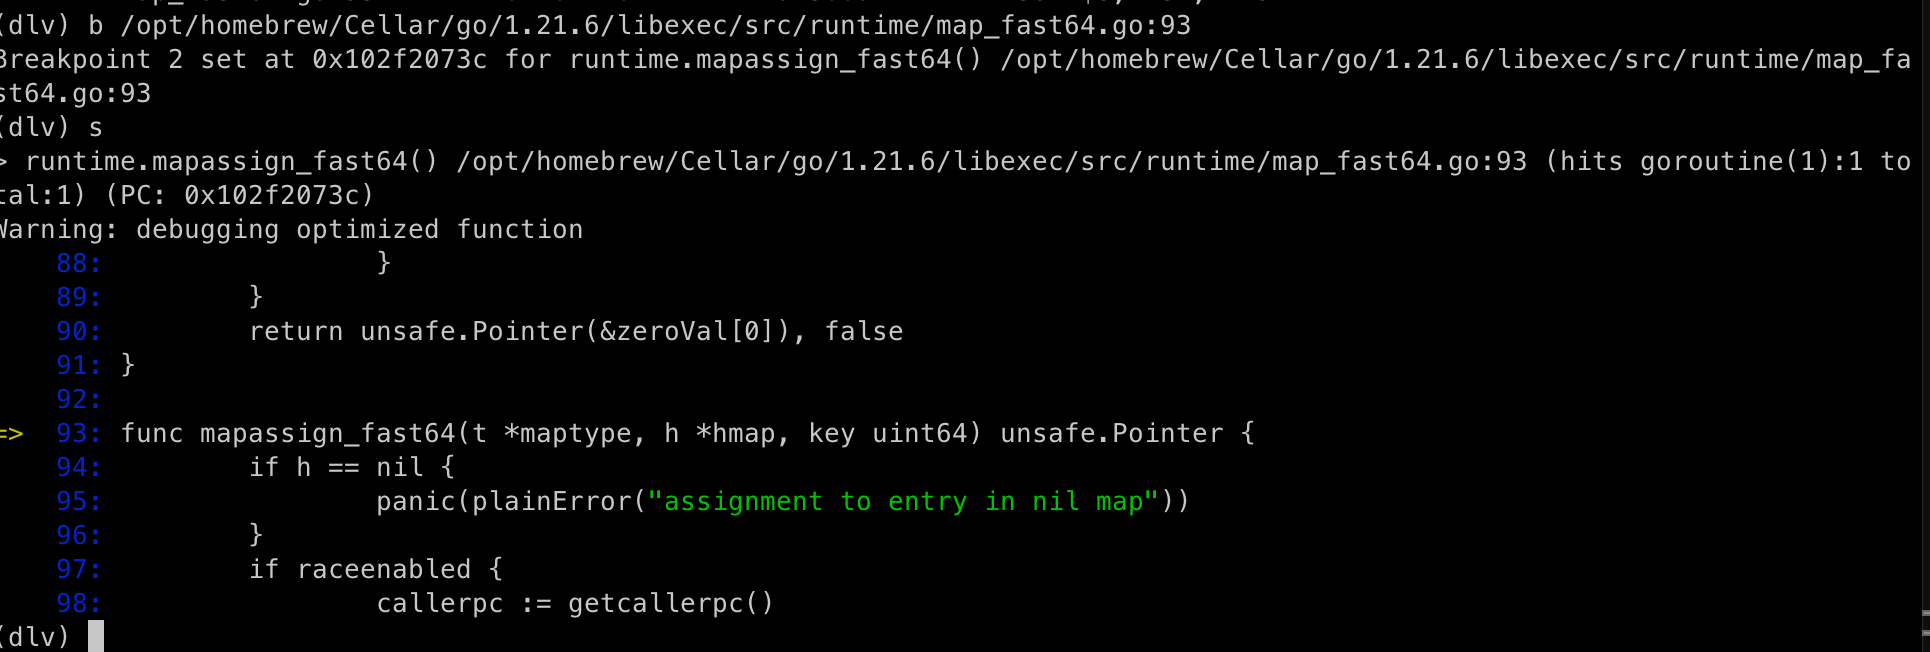
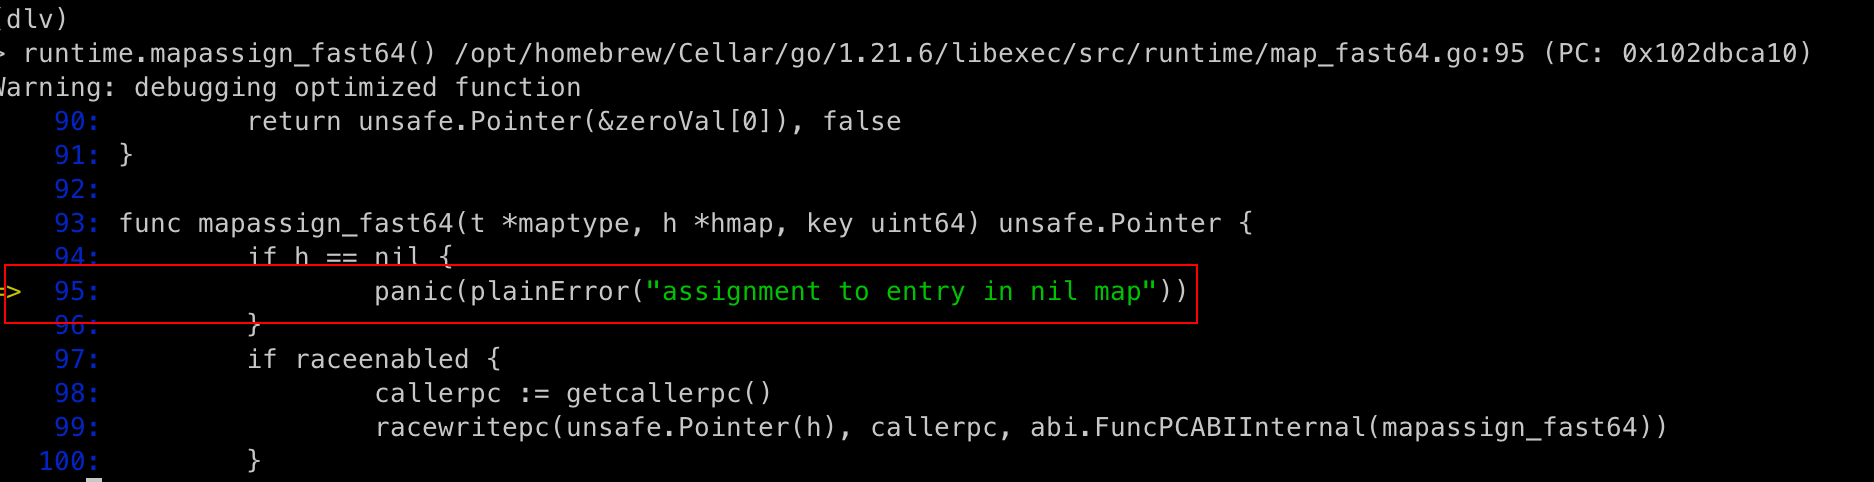
At this point, we have found the code that triggers a panic when assigning to a nil map. From here, we can follow the graph and locate the corresponding position in the runtime source code for further exploration.
In addition, we can use the bt command to view the call stack:
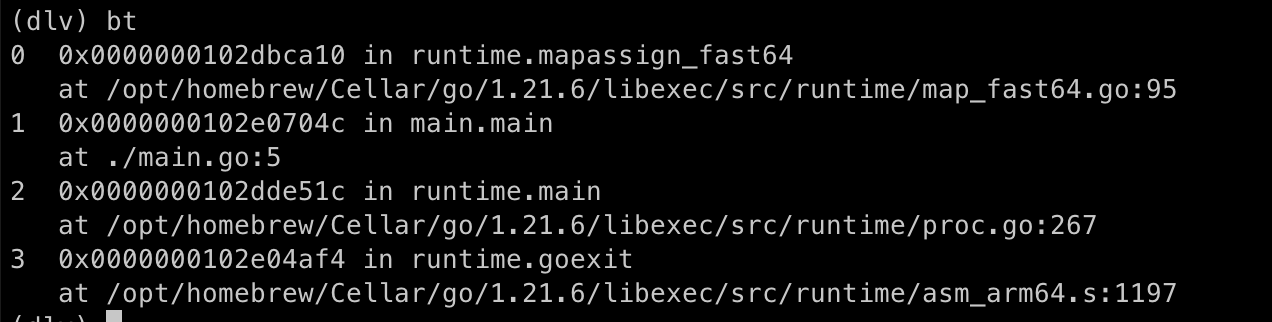
Using the frame 1 command, we can jump to the corresponding position. In this case, 1 corresponds to the main.go:5 line where we set the breakpoint. Isn’t it fascinating?
In the graph above, we can also clearly see that the user goroutine is called all the way by the goexit function. When the user goroutine completes, it goes back to the goexit function to do some finalization work. However, that’s beyond the scope of our discussion.
Additionally, dlv can also help us with the second part, “Locating the Runtime Source Code.”
Summary
Today, I provided systematic methods for viewing runtime source code or assembly code corresponding to user code using commands and tools, which is very practical. To summarize:
go tool compilego tool objdumpdlv
In the future, we will continue analyzing Go source code using these tools, such as for maps and slices. With these tools, our learning process will be more efficient.