
Analyzing Performance Bottlenecks in Go Applications with Expvar
In the development process, it’s essential to collect and sample performance data using pprof to analyze the performance bottlenecks of Go applications. There are two methods for collecting and sampling data:
- At the micro level, performance benchmark tests can be used to collect and sample data, suitable for identifying performance bottleneck points within functions or method implementations.
- At the macro level, independent programs are used to collect and sample data. However, when sampling performance data through independent programs, it’s often challenging to quickly capture the real bottleneck points, especially for complex internal structures, excessive business logic, and concurrent Go programs. When sampling performance for such programs, the real bottleneck points may be overshadowed by other data.
So, how can we efficiently capture the performance bottleneck points of an application?
We can deploy agents or use other methods to obtain probing data by querying external features of the application (such as checking if a certain port of the application responds and returns the correct data or status code). In addition to these messages, we may also want to know some introspective messages, such as more context information about the application’s state. This context information can be about the application’s usage of various resources, such as how much memory the application consumes, or custom performance metric information, such as the number of external requests processed per unit time, response latency, queue backlog, etc.
At this point, we need another package provided by Go’s official, expvar .
Package expvar provides a standardized interface to public variables, such as operation counters in servers. It exposes these variables via HTTP at /debug/vars in JSON format.
We can easily use the expvar package the Go standard library provides to output custom measurement data in a unified interface with the consistent data format and metric definitions. Let’s explore using expvar to output custom performance measurement data together in this post.
An Example
Let’s start with an example:
|
|
run and then we access http://localhost:8080/debug/vars .
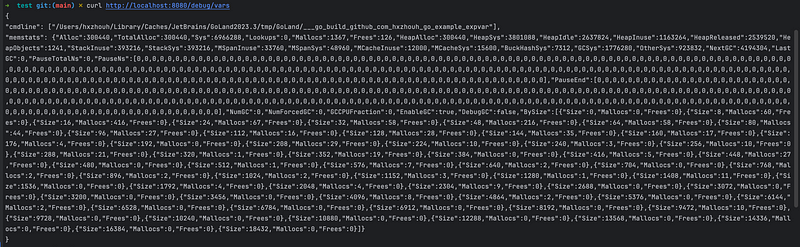
expvar returns data in standard JSON format.
The default returned status data contains two fields: cmdline and memstats.
These output data are variables published by the expvar package in the init function:
|
|
cmdline: The meaning of the cmdline field is the application name of the output data. Here, since it is an application run through go run, the value cmdline is an application under a temporary path.
memstats: The data output memstats corresponds to the runtime.Memstats structure, reflecting the status of heap memory allocation, stack memory allocation, and GC during the application’s runtime. The fields of the runtime.Memstats structure may change with the evolution of Go versions, and their specific meanings can be found in the comments of the Memstats structure.
Outputting Custom Measurement Data through Expvar
Similarly, let’s illustrate how to output custom measurement data with an example:
|
|
As shown in the example above, after defining a expvar.Map type variable, we can add metrics to this composite metric variable, such as “hi_count” in the example.
Then rerun the example. First, call localhost:8080/hi twice:
|
|
expvar outputs the desired results. Expvar can output desired results, but we won’t delve into that here.
Displaying Output Data
Through the /debug/vars service endpoint, we can obtain application internal state data in standard JSON format. Once the data is collected, it can be transformed and displayed according to the needs of different developers. JSON format text is easy to deserialize, and developers can parse and use it themselves, such as writing a Prometheus exporter to import data into the storage behind Prometheus (such as InfluxDB) and visually displaying it through some web-based graphical methods; or importing it into Elasticsearch, and then displaying it through Kibana or Grafana.
Here we showcase expvarmon developed by Go developer Ivan Daniluk. First, install it:
|
|
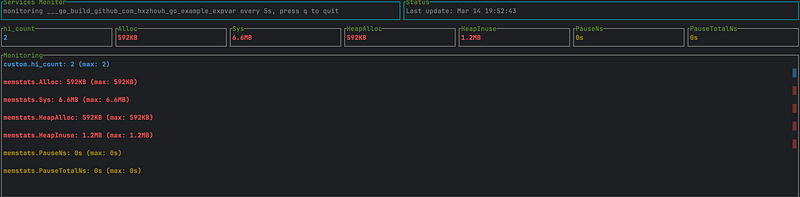
Then, view the data:
|
|
The result is quite geeky.
The expvar package can not only assist in narrowing down the range of performance bottlenecks but also be used to output measurement data to monitor the running status of the application. In this way, when problems occur in the program, we can quickly identify the problem and diagnose and locate it quickly using the output measurement data.
Difference from Pprof
pprof is another built-in performance profiling tool in Go that is mainly used to analyze the CPU usage and memory consumption of programs. Unlike, which provides real-time monitoring of internal variables, pprof is more focused on performance analysis and optimization. In short, expvar helps us observe the “active” data of the program while pprof focusing on “performance” data.
expvar exposes real-time status data of the application simply, such as the current number of active connections or the counter of requests processed. Its design intent is to monitor the application state over the long term, making it a straightforward tool for developers who want to understand the application’s health status quickly.
Conclusion
expvar is a powerful tool that can help us monitor the internal situation of applications and easily integrate with other monitoring platforms. It is a tool that every gopher should master.