Although Go’s garbage collection (GC) mechanism has undergone multiple rounds of optimization in recent years, its performance bottlenecks — especially in high-concurrency and large-memory scenarios — remain a significant focus for developers. Recently, the official Go team stirred up a discussion on GitHub with their proposal for Green Tea GC (#73581): can it further address the time cost of Go’s GC? This article dives deep into Go’s GC’s design, shortcomings, and real-world performance — and looks at the technical breakthroughs behind Green Tea GC.
https://www.reddit.com/r/golang/comments/173n28q/the_myth_of_go_garbage_collection_hindering/
📦 Design and Implementation of Go GC
Since Go 1.5, Go has used a concurrent mark-sweep algorithm combined with the tri-color marking model and yuasa-style.
In simple terms, Go’s GC runs in the background, concurrently traversing the heap, marking reachable objects, and gradually cleaning up unreferenced memory blocks. Throughout this process, Go aims for low latency and minimal pause times:
✅ Concurrent marking and sweeping
✅ No object movement (i.e., no compaction)
✅ Batch sweeping by spans (memory blocks) to reduce the duration of each Stop-the-World (STW) phase
This design’s direct benefit is that applications can mostly run in parallel with GC, keeping maximum pause times typically below the millisecond level.
🚧 Known Issues with Go GC
While Go GC delivers excellent latency, it still has several hard-to-ignore issues when it comes to time consumption and scalability, particularly:
1️⃣ Inefficient memory access
During the mark phase, GC jumps across objects, causing frequent CPU cache misses and memory waits — about 35% of GC’s CPU cycles are spent “waiting on memory.” This problem is especially pronounced on NUMA architectures or multi-core, large-memory machines.
2️⃣ Lack of generational collection
Go GC has no generational mechanism; all objects are treated the same. This becomes cumbersome in high-allocation scenarios. Engineers at Pinterest have pointed out that GC’s CPU usage spikes when memory pressure rises, triggering latency surges.
3️⃣ High CPU usage from frequent GCs
Twitch’s engineering team reported that even with small to medium heaps (<450 MiB), under steady-state conditions, the system triggers 8–10 GCs per second, up to 400–600 per minute, consuming roughly 30% of CPU time. This directly squeezes out the execution time for application threads.
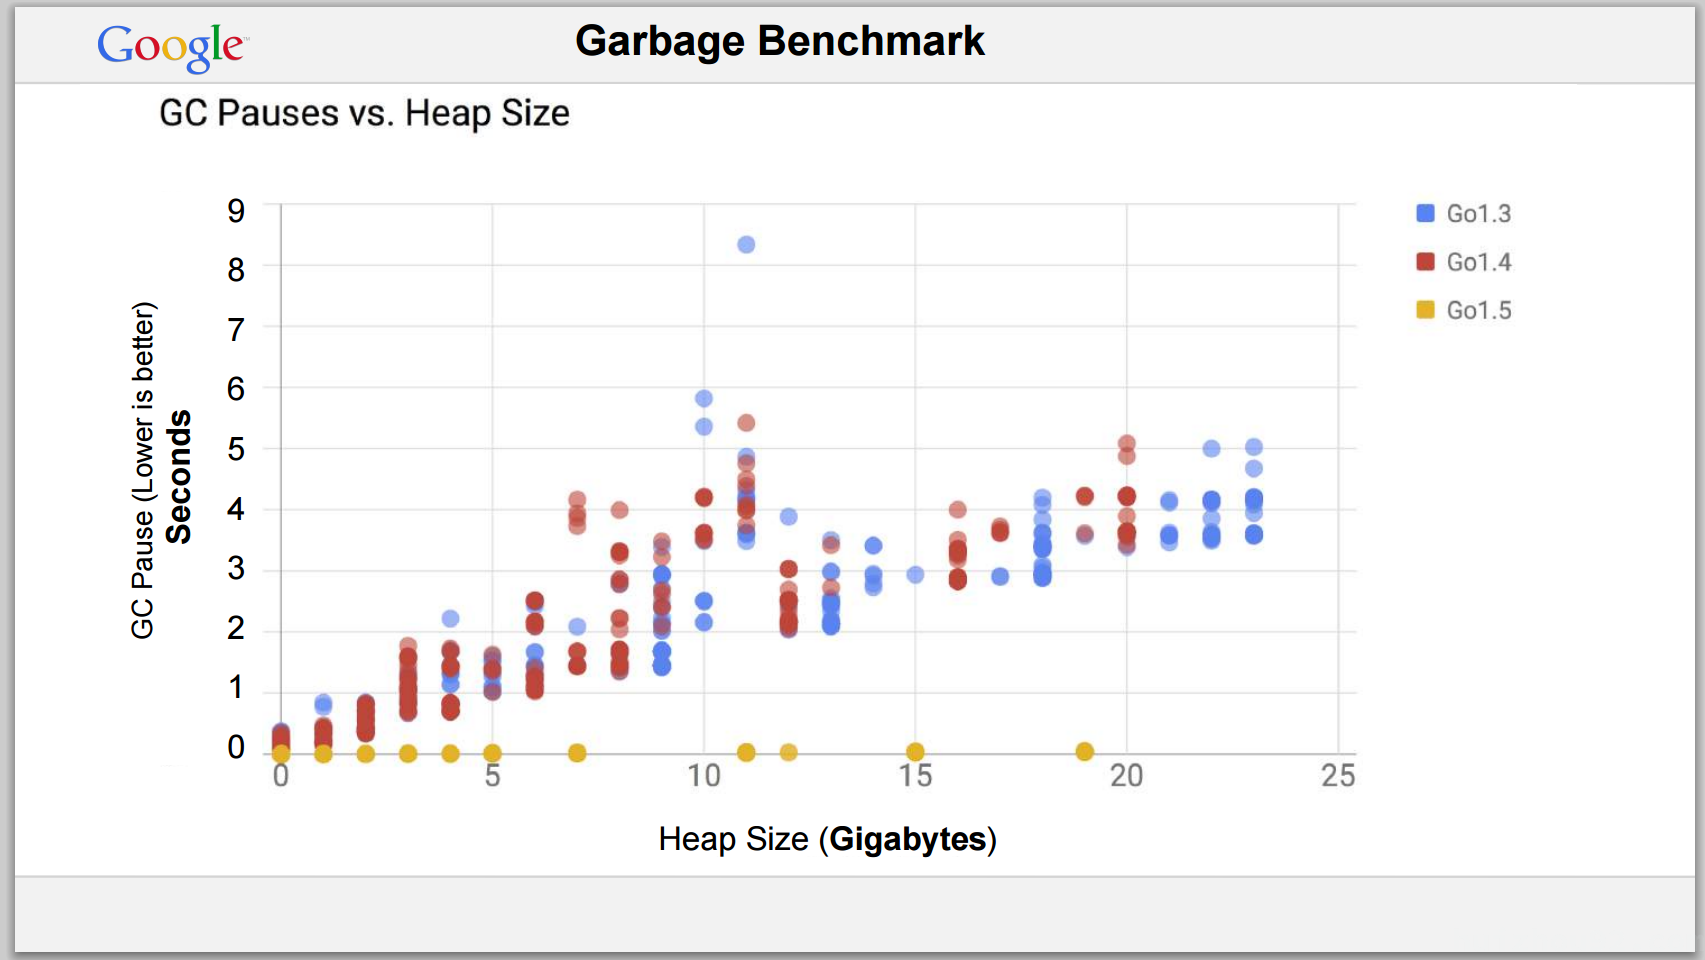
📊 Performance Testing: How GC Impacts Go Programs
Let’s look at some real-world benchmark changes:
-
Go 1.3/1.4 (before concurrent GC)
On large heaps (10GB+), GC pauses were measured in seconds. -
Go 1.5 (with concurrent GC introduced)
Under the same conditions, GC pauses shrank to <1ms.
-
Go 1.6–1.8
With heaps up to 200GB, GC pauses stayed under 20ms, often around 1ms in normal operation.
These improvements are impressive, but note:
✅ Latency control is excellent
⚠️ Total time spent and CPU consumption remain significant, especially under heavy load or high allocation rates.
🌿 Green Tea GC: A New Optimization Approach
To address these issues, the Go team has proposed Green Tea GC. Its core innovation is:
Upgrading from per-object scanning to per-span (memory block) batch scanning.
Specifically:
- For small objects (≤512B), marking moves from per-object granularity to span-level granularity.
- Only the first marked object pushes the entire span into the scan queue within each span.
- During the GC scan phase, entire spans are batch-processed, significantly improving memory access locality.
Additionally, Green Tea improves parallel queue management, using a work-stealing mechanism similar to Go’s scheduler, further boosting multi-core scalability.
⚡ Green Tea GC in Benchmark Tests
Initial benchmarks show that Green Tea GC delivers selective performance gains:
✅ Tile38 benchmark (high-fanout tree structures)
- GC overhead reduced by ~35%
- Throughput, latency, and memory usage all improved
⚠ bleve-index benchmark (low-fanout, highly mutating workloads)
- Objects are scattered with poor memory locality.
- Green Tea’s performance is similar to, or sometimes slightly worse than, standard GC.
Summary: Green Tea isn’t a “silver bullet,” but it shows clear advantages in workloads with good memory locality and heavy multi-core scaling — and lays the groundwork for future hardware optimizations like SIMD acceleration.
🏁 Summary
| Comparison Item | Current Go GC | Green Tea GC |
|---|---|---|
| Marking granularity | Per object | Per span (batch) |
| Memory locality | Poor, random jumps | High, batches within the same span |
| Multi-core scalability | Limited | Improved, using work-stealing queues |
| Performance gains | Near low-latency limits | Up to 35% GC time reduction in some cases |
| Suitable application | General workloads | Memory-locality-rich, allocation-heavy workloads |
For developers chasing extreme performance, Green Tea GC offers an exciting new direction. To try it out, you can enable the experimental flag in Go 1.25+.
📝 References
- GitHub Issue #73581
- https://stackoverflow.com/questions/31684862/how-fast-is-the-go-1-5-gc-with-terabytes-of-ram
- https://www.reddit.com/r/golang/comments/173n28q/the_myth_of_go_garbage_collection_hindering/
- Long Time Link
- If you find my blog helpful, please subscribe to me via RSS
- Or follow me on X
- If you have a Medium account, follow me there. My articles will be published there as soon as possible.