I Studied Beszel’s Source -- It’s What You Use Before Prometheus
A small Go hub, simple agents, and enough monitoring for the awkward middle between nothing and Prometheus.
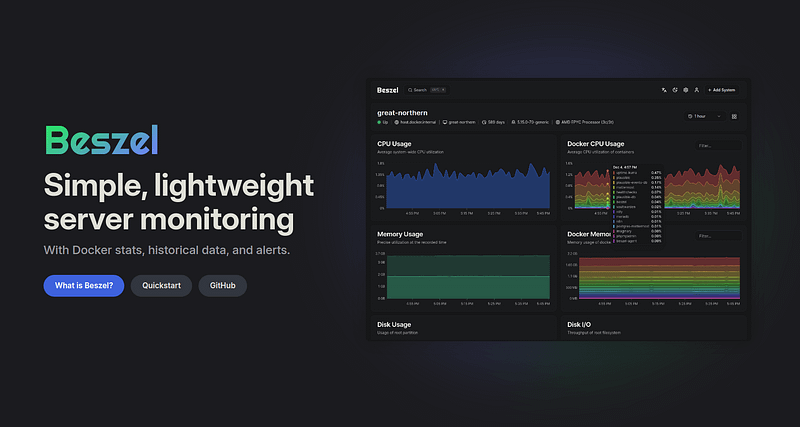
GOLANG TOOLS
I Studied Beszel’s Source — It’s What You Use Before Prometheus
I opened Beszel’s GitHub repository on June 16, 2026, expecting a familiar kind of project: a polished dashboard for people who do not want to learn Prometheus.
The repository had 22,754 stars.
It was created on July 7, 2024.
The latest release was v0.18.7, published on April 5, 2026.
The numbers explain the attention. They do not explain why the project works.
Calling Beszel a “Grafana alternative” misses the design. The more useful observation is that Beszel rejects most of what makes Prometheus and Grafana powerful.
No PromQL.
No separate time-series database.
No dashboard provisioning system.
No exporter zoo before the first chart appears.
For the right user, that absence is the product.
The Monitoring Problem Nobody Wants To Admit
Prometheus plus Grafana is the right answer for many production systems. It is also a lot of machinery when your actual problem is:
“Are my three servers alive?”
“Which container is eating RAM?”
“Is the disk filling up?”
“Did my GPU disappear after the driver update?”
“Can I get an alert before a disk or GPU problem wakes me up at 2 a.m.?”
For that class of monitoring, the standard stack can feel upside down. You start by deploying the monitoring system, then exporters, then scraping rules, then dashboards, then alerting, then notification routing.
Beszel starts from a smaller premise:
A lightweight monitor should be useful before it becomes a platform.
You can see that premise all over the codebase.
The One-Minute Version
The hub runs as a single service. The official Docker command looks like this:
docker volume create beszel_data && \
docker run -d \
  --name beszel \
  --restart=unless-stopped \
  --volume beszel_data:/beszel_data \
  -e APP_URL=http://localhost:8090 \
  -p 8090:8090 \
  henrygd/beszel
Open http://localhost:8090, create the first admin user, then add a system from the web UI.
The hub generates the agent command for you. If you use the binary agent, the shape is:
./beszel-agent \
  -key "<public key>" \
  -token "<token>" \
  -url "<hub url>"
If you use Docker, the official agent example uses host networking and a read-only Docker socket:
docker run -d \
  --name beszel-agent \
  --network host \
  --restart unless-stopped \
  -v /var/run/docker.sock:/var/run/docker.sock:ro \
  -e KEY="<public key>" \
  -e HUB_URL="<hub url>" \
  -e TOKEN="<token>" \
  -e LISTEN=45876 \
  henrygd/beszel-agent:latest
That is the main usability difference.
Prometheus asks you to model the world. Beszel asks you to add a system.
The Architecture Is Boring In The Right Way
There are only two moving pieces:
Hub: a web app built on PocketBase.
Agent: a Go process running on each monitored system.
The hub provides the dashboard, user management, APIs, alerting, persistence, and scheduled aggregation. PocketBase gives it SQLite, authentication, API plumbing, and static file serving without making the default deployment grow a second backend.
The agent collects host metrics, Docker or Podman container stats, GPU data, SMART disk data, systemd service status, sensors, battery state, and network/disk deltas.
The important part is where the work happens. The agent does more than forward raw counters. It normalizes host data, tracks deltas, handles Docker quirks, caches collection results, and packages a snapshot for the hub.
The hub polls at a default 60-second interval and writes records into PocketBase collections backed by SQLite.
This is not a general observability pipeline. It is a narrow monitoring system, and that narrowness is why it feels fast to set up.
The Clever Part: Two Ways To Reach The Agent
Beszel supports two transport paths between the hub and the agent:
WebSocket: the agent connects out to the hub.
SSH: the hub connects to the agent’s embedded SSH server.
This part is easy to misunderstand.
WebSocket mode is useful when the agent can reach the hub URL. The agent initiates a connection to /api/beszel/agent-connect, sends a token in the upgrade request, and then participates in a mutual authentication flow.
SSH mode is the opposite direction. The hub connects to the agent’s SSH server, usually on port 45876. The official docs describe this as ideal when the hub can reach the agent, but the agent cannot reach the hub.
The source code makes the priority clear.
The agent tries WebSocket first. If that fails, it starts the SSH server. The connection manager has three states:
Disconnected
WebSocketConnected
SSHConnected
It also has a WebSocket retry ticker set to 10 seconds.
That small state machine matters because networks are messy. Some users run everything on one machine. Some put the hub behind a reverse proxy. Some monitor remote boxes over private networks. Some only allow outbound connections from agents.
Beszel does not force one topology. It gives you two.
The Security Model Is Better Than A Shared Token
The original Chinese draft described SSH key authentication correctly. The full security model is more interesting.
On first startup, the hub generates an Ed25519 key pair.
In SSH mode, the agent’s embedded SSH server accepts connections using that hub key only. The server disables pseudo-terminals. The docs explicitly state that it does not accept input, so even a compromised private key does not become a remote shell.
In WebSocket mode, the flow is different:
- The agent connects with a registration token.
- The hub verifies the token before upgrading the connection.
- The hub signs the token with its private key.
- The agent verifies that signature using the public key it was given.
- The agent sends a machine fingerprint.
- The hub checks that fingerprint against the system record.
That last step matters. The token is not the whole identity. After registration, the agent is tied to the machine fingerprint.
For a small monitoring tool, this is the right kind of security: not enterprise ceremony, but not “paste a bearer token everywhere and hope” either.
Why Go Is A Good Fit Here
Beszel is mostly Go, with a TypeScript front end embedded into the hub. That choice is not cosmetic.
Monitoring agents live in awkward places: tiny VPS instances, Raspberry Pis, NAS boxes, old mini PCs, FreeBSD machines, Windows systems, macOS laptops, and sometimes routers or edge hardware.
A small Go binary fits that world.
The current release assets include Linux, FreeBSD, OpenBSD, macOS, and Windows builds across multiple architectures, including amd64, arm64, arm, mips, mipsle, ppc64le, and riscv64 in the agent artifacts.
The code also leans into Go’s ecosystem:
gopsutilfor cross-platform system metrics.PocketBasefor the hub backend.fxamacker/cborfor binary message encoding.gliderlabs/sshfor the embedded SSH server.lxzan/gwsfor WebSocket handling.nicholas-fedor/shoutrrrfor notification URLs.puregofor the experimental NVML path on supported Linux builds.
The useful lesson is not “Go is fast.” The useful lesson is this:
Go makes the operational shape of Beszel simple.
One hub binary.
One agent binary.
Docker images when you want them.
No JVM. No Node runtime on the server. No separate database to babysit for the default path.
The Data Model: SQLite With Time Buckets
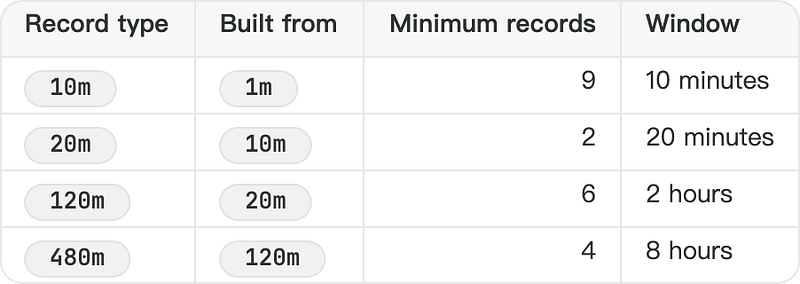
SQLite is not Prometheus, and Beszel does not pretend otherwise. It stores high-resolution data briefly, then creates coarser records in the background.
The RecordManager code defines the aggregation ladder:
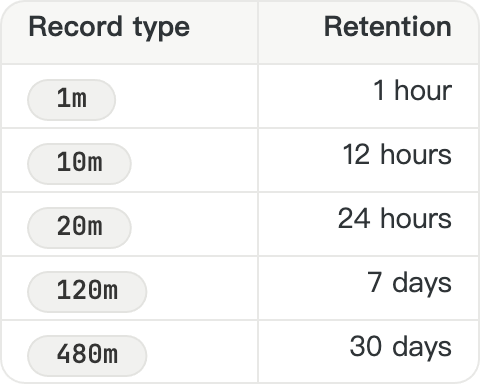
Old records are deleted by type:
The system_stats and container_stats collections both have indexes on:
system, type, createdThat tells you the intended query pattern: fetch recent metrics for one system, one bucket type, over time.
This is not a general time-series database design. It is a monitoring-history design for a UI with fixed time ranges.
The Agent Does The Unpleasant Work
Every monitoring system eventually discovers that collecting metrics is full of edge cases. Beszel’s agent has a few practical details worth copying.
First, it caches system data by polling interval. A cached entry is considered fresh for half of its configured interval. For the default 60-second path, that gives the agent room to absorb timing jitter without re-collecting everything.
Second, it uses delta trackers for counters. Network and disk counters are cumulative at the OS level. A dashboard wants rates. The agent keeps previous values per interval and turns counters into bytes per second.
Third, Docker stats are not treated as a clean API.
The agent reads the Docker or Podman API through a local socket, disables HTTP compression for local calls, reuses buffers, tracks CPU and network deltas per cache interval, and carries version-aware logic around Docker’s one-shot=1 behavior.
There is a production smell here. Not fancy. Just defensive.
The code assumes the host can be weird, the container engine can be old, and the numbers can be wrong.
That is usually how agent software survives.
GPU Monitoring Is Useful, But Not Magic
The original draft made the GPU story sound cleaner than it is. The real implementation is more nuanced.
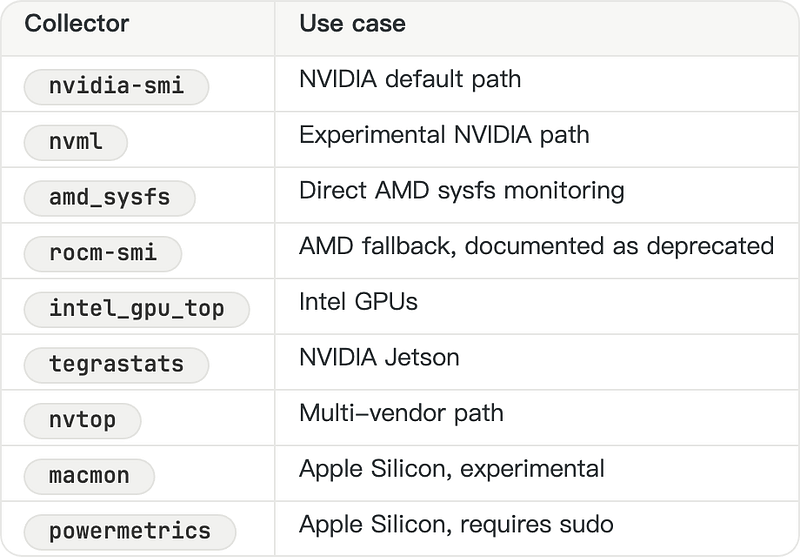
Beszel can collect GPU usage, temperature, memory, and power draw across several vendors and platforms, but the collector depends on what is available on the machine.
The official docs list these collectors:
The NVML implementation is interesting because the Linux glibc/amd64 path uses purego to dynamically open libnvidia-ml.so.1.
That avoids a CGo dependency for that path.
But it would be wrong to describe all GPU monitoring as “pure Go.” Some collectors call external tools. Some need device permissions. Some need special Docker images. Intel monitoring needs intel_gpu_top or nvtop. Apple Silicon support is opt-in and experimental.
That is still a reasonable engineering tradeoff. Beszel does not pretend hardware is clean. It wraps the messy tools people already have.
Alerts Are Built In, But Simple
Beszel supports configurable alerts for CPU, memory, disk, bandwidth, temperature, load average, battery, GPU usage, status, SMART data, and related system conditions.
Notifications use Shoutrrr URL schemas, with docs for common services like Discord, Slack, Telegram, Matrix, Gotify, Ntfy, Pushover, Teams, Lark, WeCom, and generic webhooks.
There is also email through PocketBase’s mail configuration.
This is the right alerting scope for Beszel.
You can tell a user:
“Alert me when this system goes down.”
“Alert me when disk usage crosses this threshold.”
“Alert me when the drive health changes.”
You cannot tell Beszel:
“Evaluate this PromQL expression across 600 labels, group by service, silence by route, then page the right team through a multi-stage escalation policy.”
That is fine. If you need that, you already know why Prometheus Alertmanager exists.
The Comparison That Actually Matters
The wrong comparison is:
“Can Beszel replace Prometheus and Grafana?”
For serious production observability, usually no.
The better comparison is:
“How much monitoring do I need before Prometheus becomes worth its complexity?”
That question has a more useful answer.
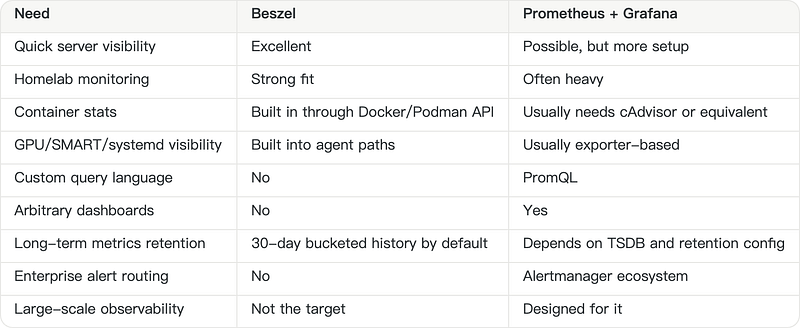
That table is the product boundary.
Beszel is not a worse Prometheus. It is a refusal to become Prometheus.
The Go Patterns Worth Stealing
Even if you never run Beszel, the codebase is worth reading if you build Go infrastructure tools. These are the patterns I would copy.
1. Use an embedded backend when the product is small enough
PocketBase gives Beszel a lot for free: SQLite, auth, REST-ish APIs, realtime plumbing, file serving, migrations, and settings.
For a lightweight self-hosted app, that is a serious advantage.
The lesson is not “always use PocketBase.” It is to notice when your app does not need a distributed backend.
2. Make the network topology flexible
WebSocket and SSH solve opposite connectivity problems.
Some users can expose the hub.
Some can only reach agents from the hub.
Some run everything through a reverse proxy.
Some use a Unix socket for a local agent.
The connection manager keeps this complexity inside the agent and hub, instead of turning it into a deployment guide full of footnotes.
3. Push normalization to the edge
The agent knows the host: OS counters, Docker socket, GPU tools, SMART device list, systemd services, network interfaces, and sensor names.
Letting the agent normalize and package data keeps the hub simple. That is not always the right design. It is right here.
4. Prefer boring retention over premature TSDB design
Beszel does not need cardinality management, PromQL optimization, or remote write. It needs enough history for the UI.
So it stores 1m, 10m, 20m, 120m, and 480m records, then deletes old buckets on a schedule.
There is humility in that design. The database only does what the product needs.
5. Treat host APIs as unreliable
Old Docker versions behave differently.
Network counters jump.
Container memory stats lie.
GPU tooling differs by vendor and OS.
Disk health collection can wake sleeping disks.
Beszel’s agent code is full of small accommodations for these realities.
That is what production-grade infrastructure code often looks like: a long list of boring fixes around boring APIs.
Where I Would Not Use It
I would not use Beszel as the primary monitoring system for a large production fleet.
I would not use it when I need high-cardinality labels, service-level metrics, request latency histograms, SLO burn-rate alerts, distributed tracing, or long-term analytical queries.
I would not put it in front of a team that already has a mature Prometheus/Grafana setup and tell them to migrate.
That would miss the point.
Beszel is for the moment before that: real servers, real containers, real disks, and real alerts, but not yet an observability platform.
The Quiet Lesson
The fastest-growing infrastructure tools often win by being less general than the incumbents. Beszel is a good example.
It does not ask you to build a monitoring architecture. It gives you a hub, an agent, a dashboard, alerts, and enough history to answer the first-order questions.
That is not enough for every system. It is enough for many systems that currently have nothing.
The next time someone says “just install Prometheus,” ask one question first:
Do we need Prometheus, or do we just need to know what our servers are doing?
For a surprising number of homelabs and small teams, Beszel is the more honest answer.
Sources Checked
- Beszel repository metadata and release history: henrygd/beszel, v0.18.7 release
- Official overview and supported metrics: What is Beszel?
- Official hub install command: Hub Installation
- Official agent install command and required variables: Agent Installation
- Transport and authentication model: Security
- Notification services: Notifications
- GPU collectors and caveats: GPU Monitoring
- Connection state machine: agent/connection_manager.go
- WebSocket client and CBOR handling: agent/client.go, internal/hub/ws/ws.go
- SSH server and CBOR compatibility: agent/server.go, internal/hub/transport/ssh.go
- SQLite aggregation and retention: internal/records/records.go, internal/records/records_deletion.go
- Docker stats implementation: agent/docker.go
- Agent cache and delta tracking: agent/agent_cache.go, agent/deltatracker/deltatracker.go
- Dependencies verified in source: go.mod